
Managing saved visualizations
To manage your saved visualizations, go to your account by clicking on your account name in the upper-right of your workspace.
There on the Visualizations tab, you can can see the list of visualizations you created and saved using the Map Builder and the Chart Builder.
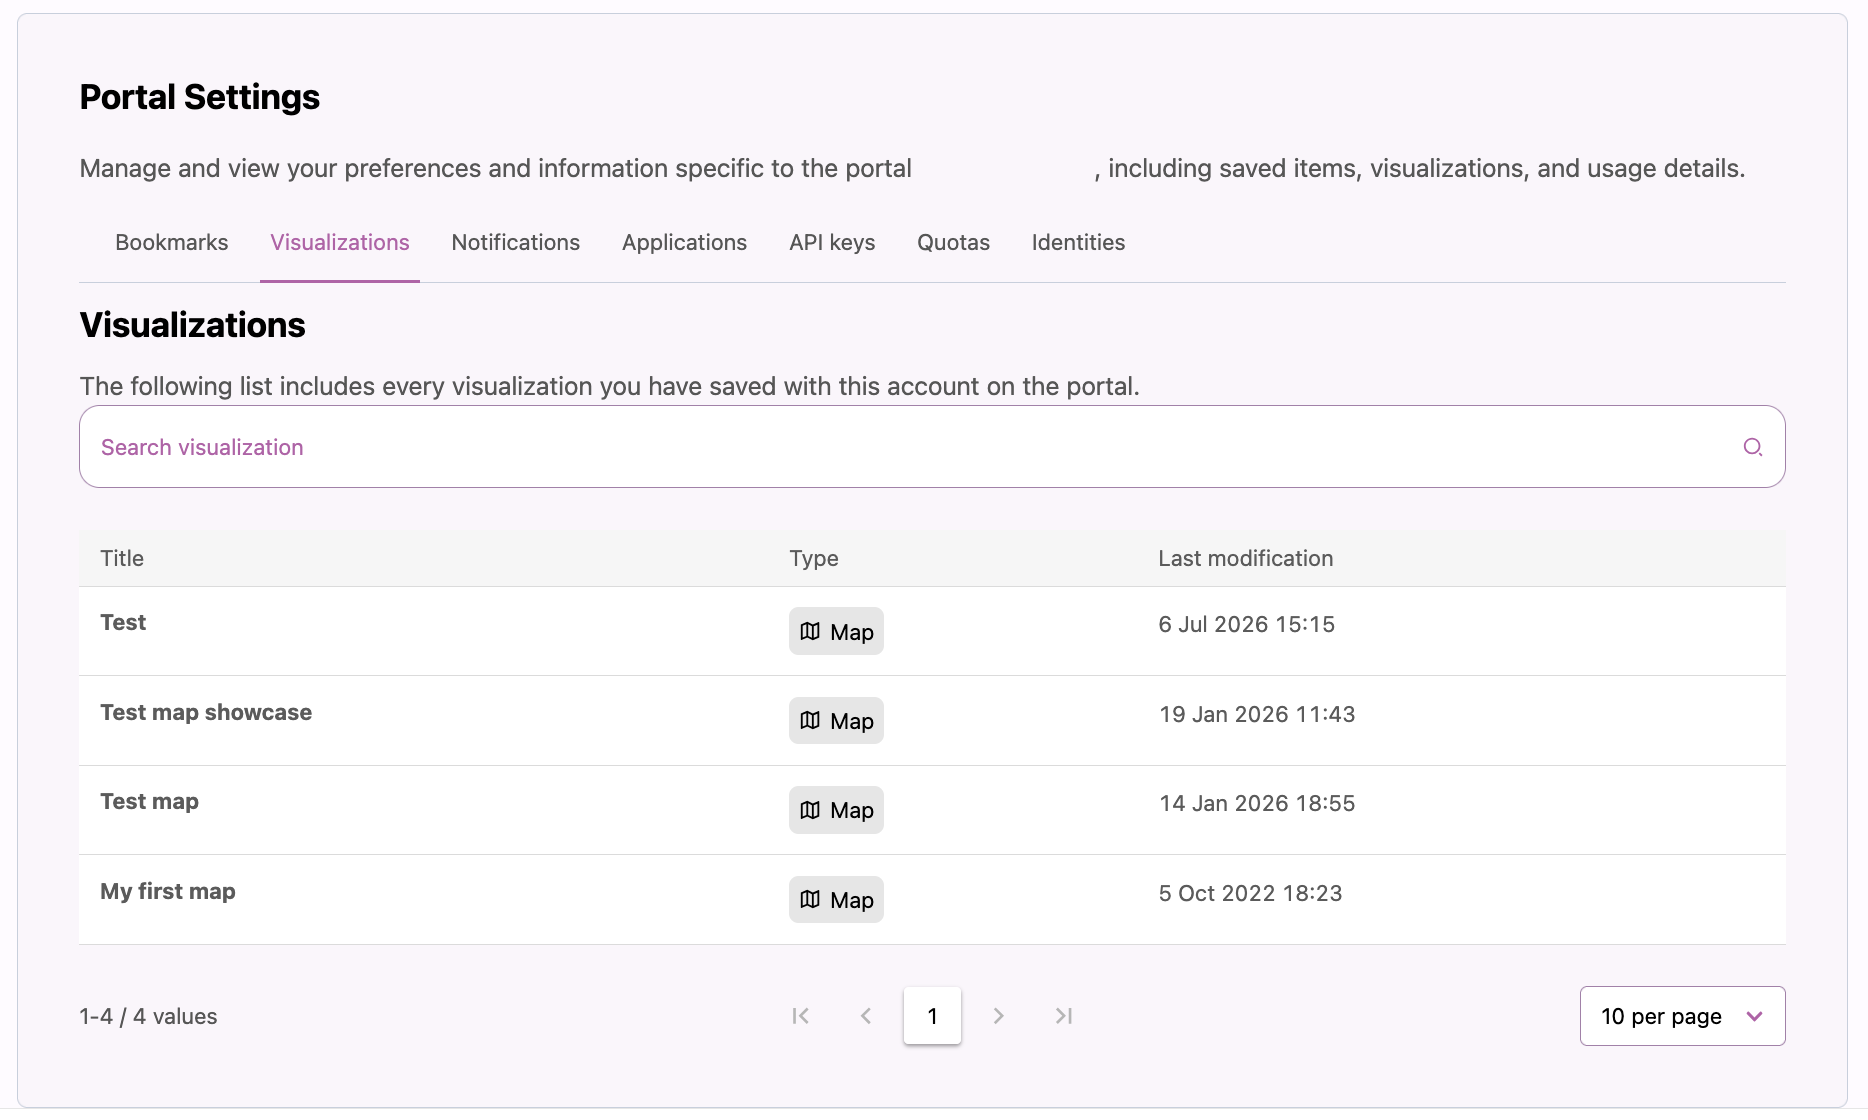
The visualizations are listed in a three-column table, where the name, type (map or chart), and last modification date are indicated.
When you roll over each line, buttons appear on the right to view or delete that visualization.
If you have a large number of visualizations, use the "Search visualization" field above the table to filter the list. Use the pagination controls below the table to browse additional results.
Opening and editing a saved visualization
In the list of visualizations, hover over the one you wish to open, and click on the view visualization icon.
Edit the visualization in the Map Builder or the Chart Builder.
Save the visualization again. The "last modification" date for that visualization should update to reflect this.
Deleting a saved visualization
Deleted visualizations cannot be restored.
Hover over the visualization in the table that you wish to delete.
Click the trash can icon.
In the pop-over, type out "DELETE" and click on the Delete visualization button to confirm.
After the visualization is deleted, a notification appears and the list is refreshed.
More information
For more information about creating visualizations, see Creating multi-layer maps and Creating advanced charts with the Charts tool.