
Adding a map with points and shapes in Studio
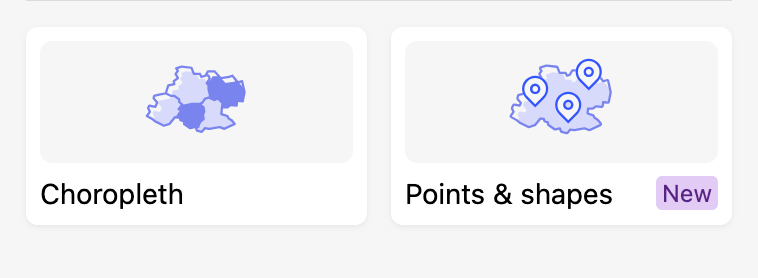
Studio makes it easy to create maps with points or shapes, as well as choropleth maps.
Points and shapes maps highlight specific locations or areas. They let you display three geometry types simultaneously: points, lines (linestrings), and shapes (polygons). They are ideal for presenting localized information — such as stores, roads, or regions — and for exploring complex geographic data.
Step 1: Select a block
To create a map with points or shapes in Studio, create or edit a block, select the block type "Map" and "Points & shapes" as the map type.
Tip: Instead of using the Next button, you can double click on a card to select it and move on to the next step.
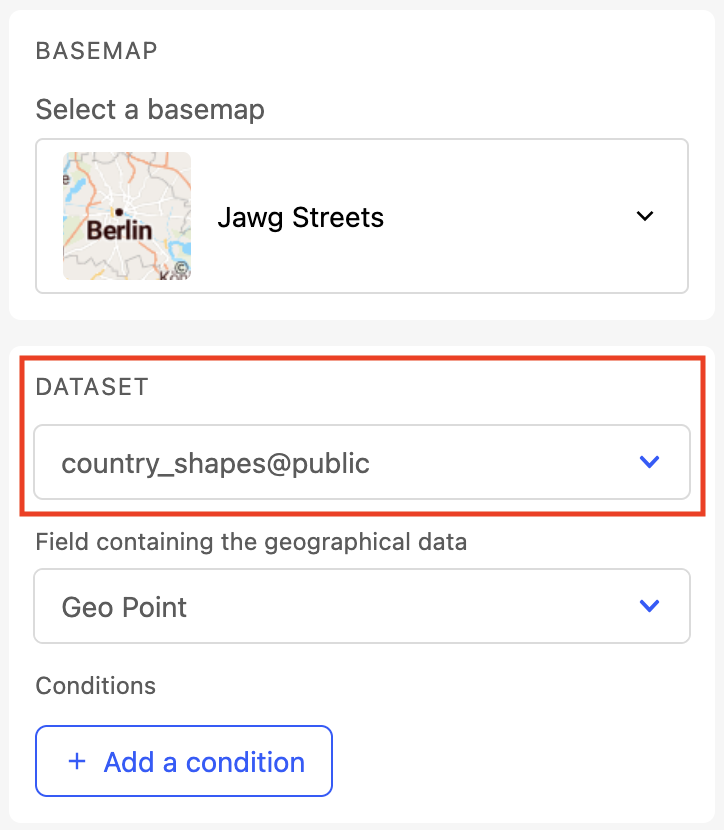
Step 2: Select the map sources
Select a basemap from those configured in the back office. To edit available basemaps, see Configuring data visualizations.
Select the desired dataset. A preview of the first 20 records opens in the preview pane.
Note that the map automatically adjusts its bounding box so that all elements are visible.
During this step, don't forget that you can refine the visible data on the map (See Refining data).
If multiple valid geographic fields are detected in the dataset, specify which one to use. The field containing the most geographic shapes is automatically selected by default
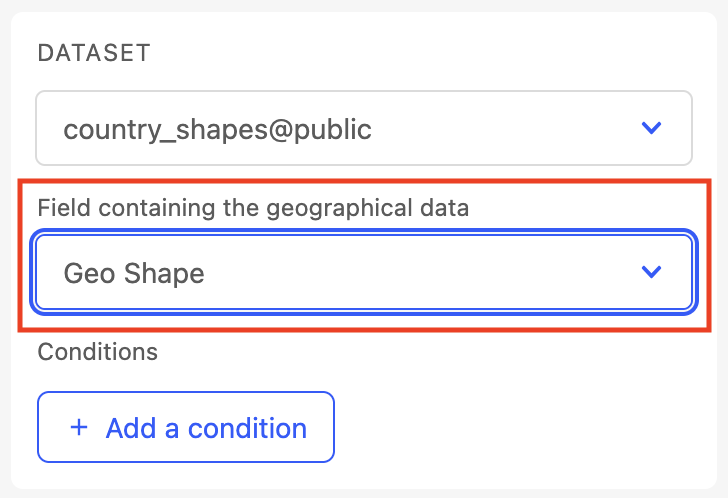
💡 Geoshape fields: a single geoshape field can contain mixed geometry types (points, lines, polygons). You will be able to choose which ones to display in the next section.
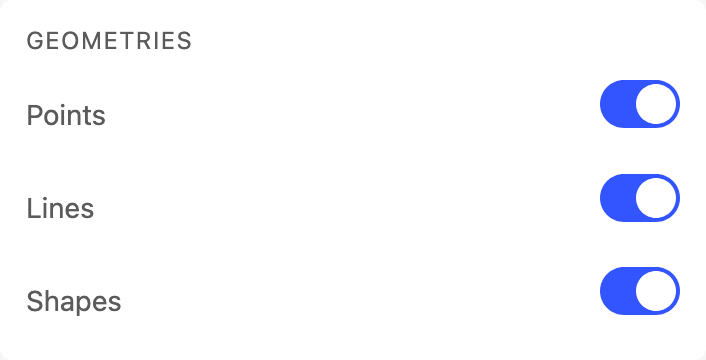
Select geometries
Once the dataset is selected, the Geometries section displays the geometry types available in the selected field.
Use the toggle controls to choose which geometries to display: Points, Lines, or Shapes.
You can display all three types simultaneously, or only some of them.
At least one geometry type must be selected. If you deselect all types, an error message is displayed.
Step 3: Configure geometry styles
Configuration options vary depending on the geometries selected in the previous step. Configure each section as needed.
Note that the geometries layers display on the map in a specific order. Points render on top, then lines, then shapes at the bottom.
For each enabled geometry type, you can:
Group by category: style elements based on a dataset field.
Manage categories: reorder (up/down arrows) or delete categories.
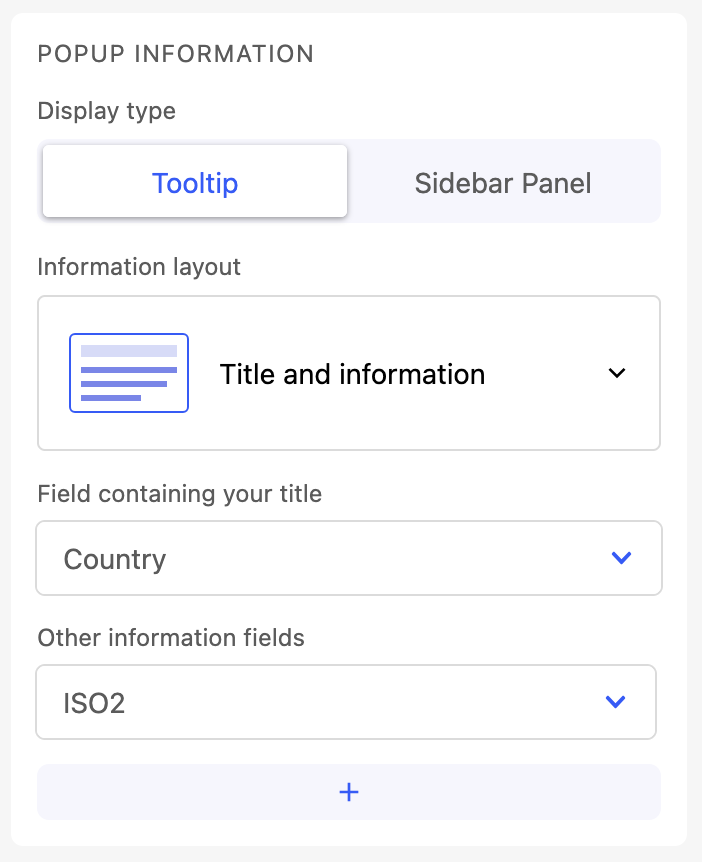
Configure the popup: see Step 4 for details.
Style parameters per category vary by geometry type:
Parameter | Points | Lines | Shapes |
|---|---|---|---|
Default color | ✅ | ✅ | ✅ |
Icon | ✅ | — | — |
Opacity (10–100%, default: 50%) | — | ✅ | ✅ |
Line thickness (1–10, default: 3) | — | ✅ | — |
Label | ✅ | ✅ | ✅ |
Step 4: Configure the popup
| Each geometry type (points, lines, shapes) has its own popup configuration, accessible from the corresponding section in Step 3.
|
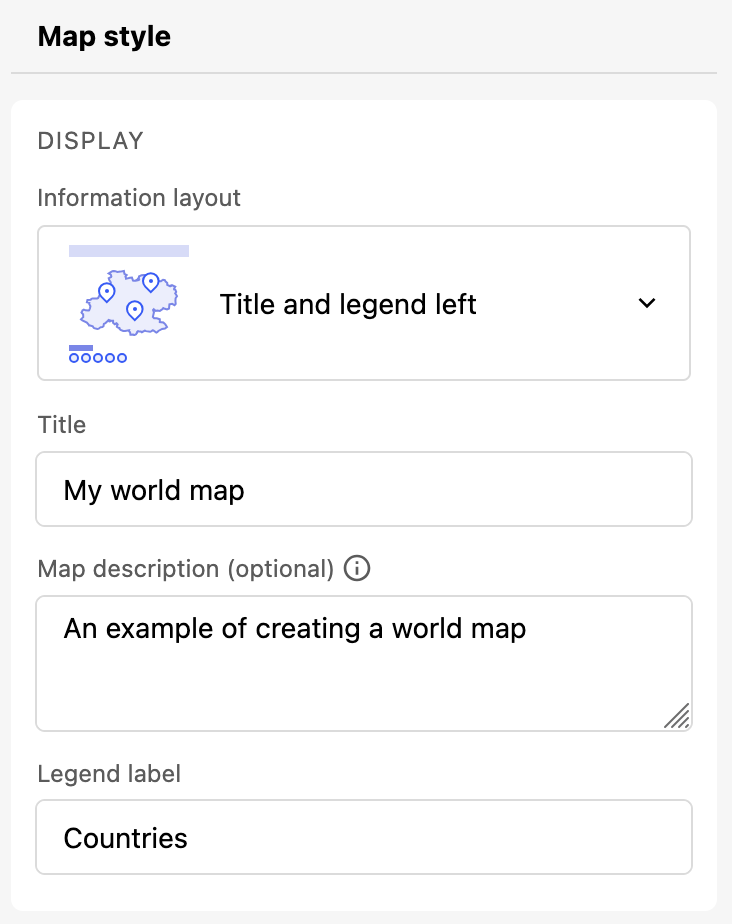
Step 5: Set the map style
Change the layout by clicking on Information layout and selecting a different one.
Fill required fields to complete the block configuration.
Regarding the map legend
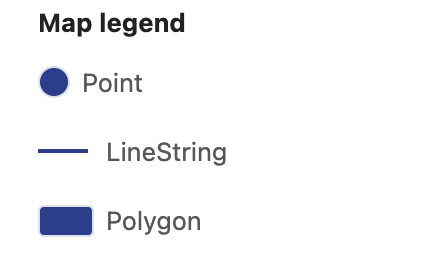
The legend displays elements sorted and grouped by geometry type.
Points and shapes: displayed with an automatic border in the legend.
Lines: displayed without a border in the legend.
Step 6: Save the map
Click Finish when you're done configuring your map. Your map will be visible in the preview pane. Verify the configuration you've chosen and click Save.
Tips:
Styling location markers based on fields with more than one value
We do not recommend using fields with more than one value to style your location makers. By default, Studio automatically uses the first value from a multi-value field to style the marker. However, this not may be what you need.
For example, imagine that you've defined the style for two location marker values: "fruits" and "vegetables." A point of interest with more than one value, such as "fruits, vegetables", will inherit its style from the "fruits" style definition. Conversely, a point of interest with the value "vegetables, fruits" will derive its style from the "vegetables" style maker definition.
So if the default behavior isn't what you need, you can create a new column using processors to extract the relevant value. This approach allows you to have more control over the styling process.