
Showcasing your data
What a showcase is
Some data assets look like a work of art: A map, a chart, or an app that is built based on a dataset and brings real value and shows just how powerful that data can be.
For example, this page uses a dataset of employee satisfaction to display this key entreprise data in a clean, visual way.
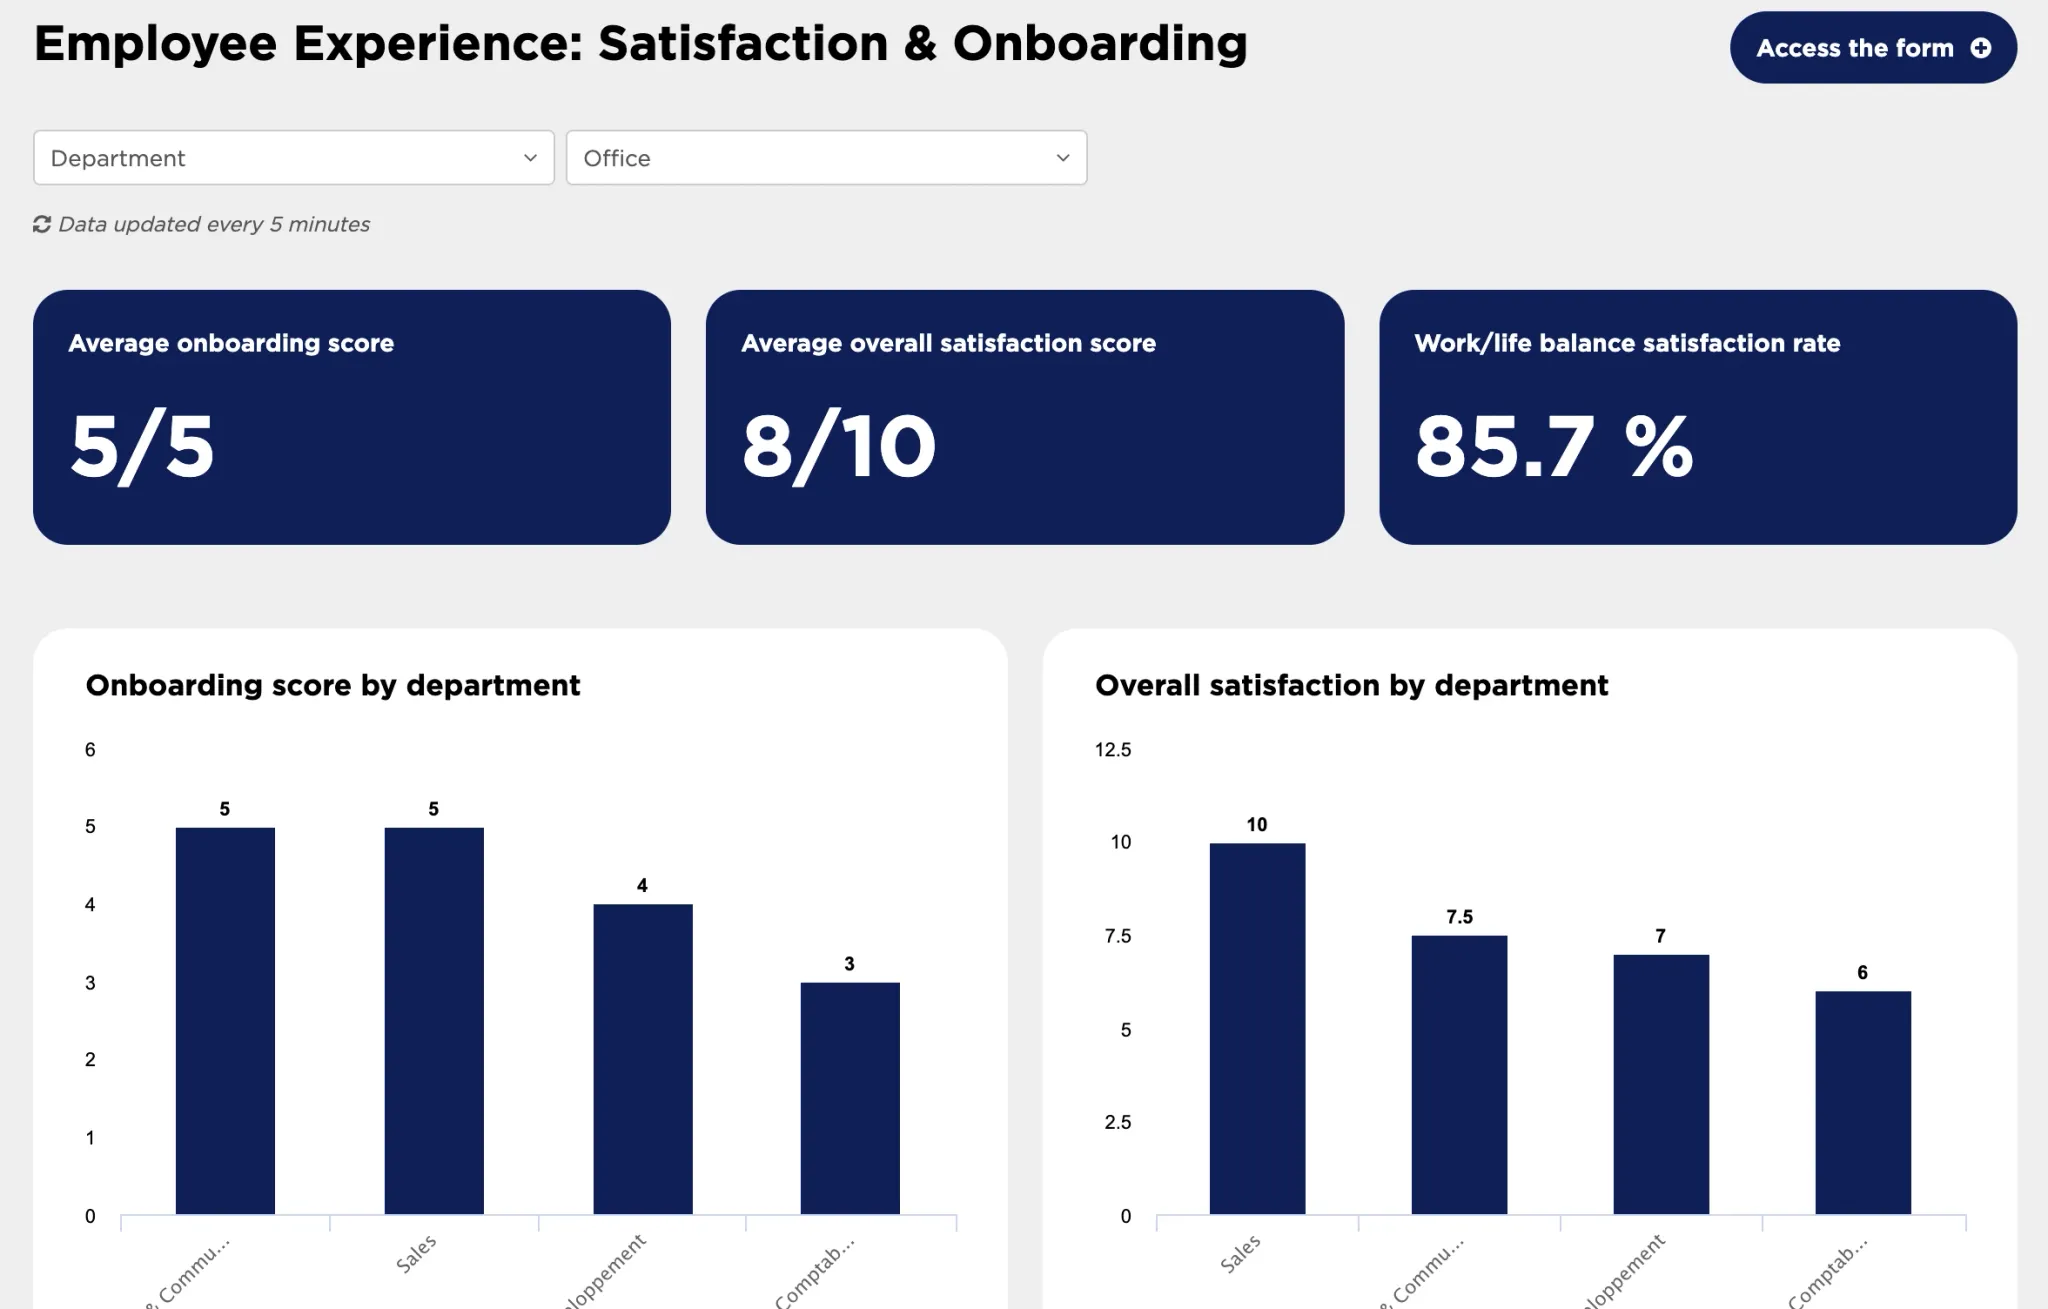
💎 So, a showcase is a concrete usage or enhancement of one or more datasets in the form of a map, visualization, external application, or any other data-driven project.
It is possible to label any asset as a showcase.
In the portal, this appears as a metadata tag that enhances the asset’s visibility (although note that since it is added as a tag, a showcase inherits the same visibility rules as its underlying asset: public, private, or shared with specific users).
Showcases are built using data from your portal. They’re an example of your data in action.
Where to find showcases
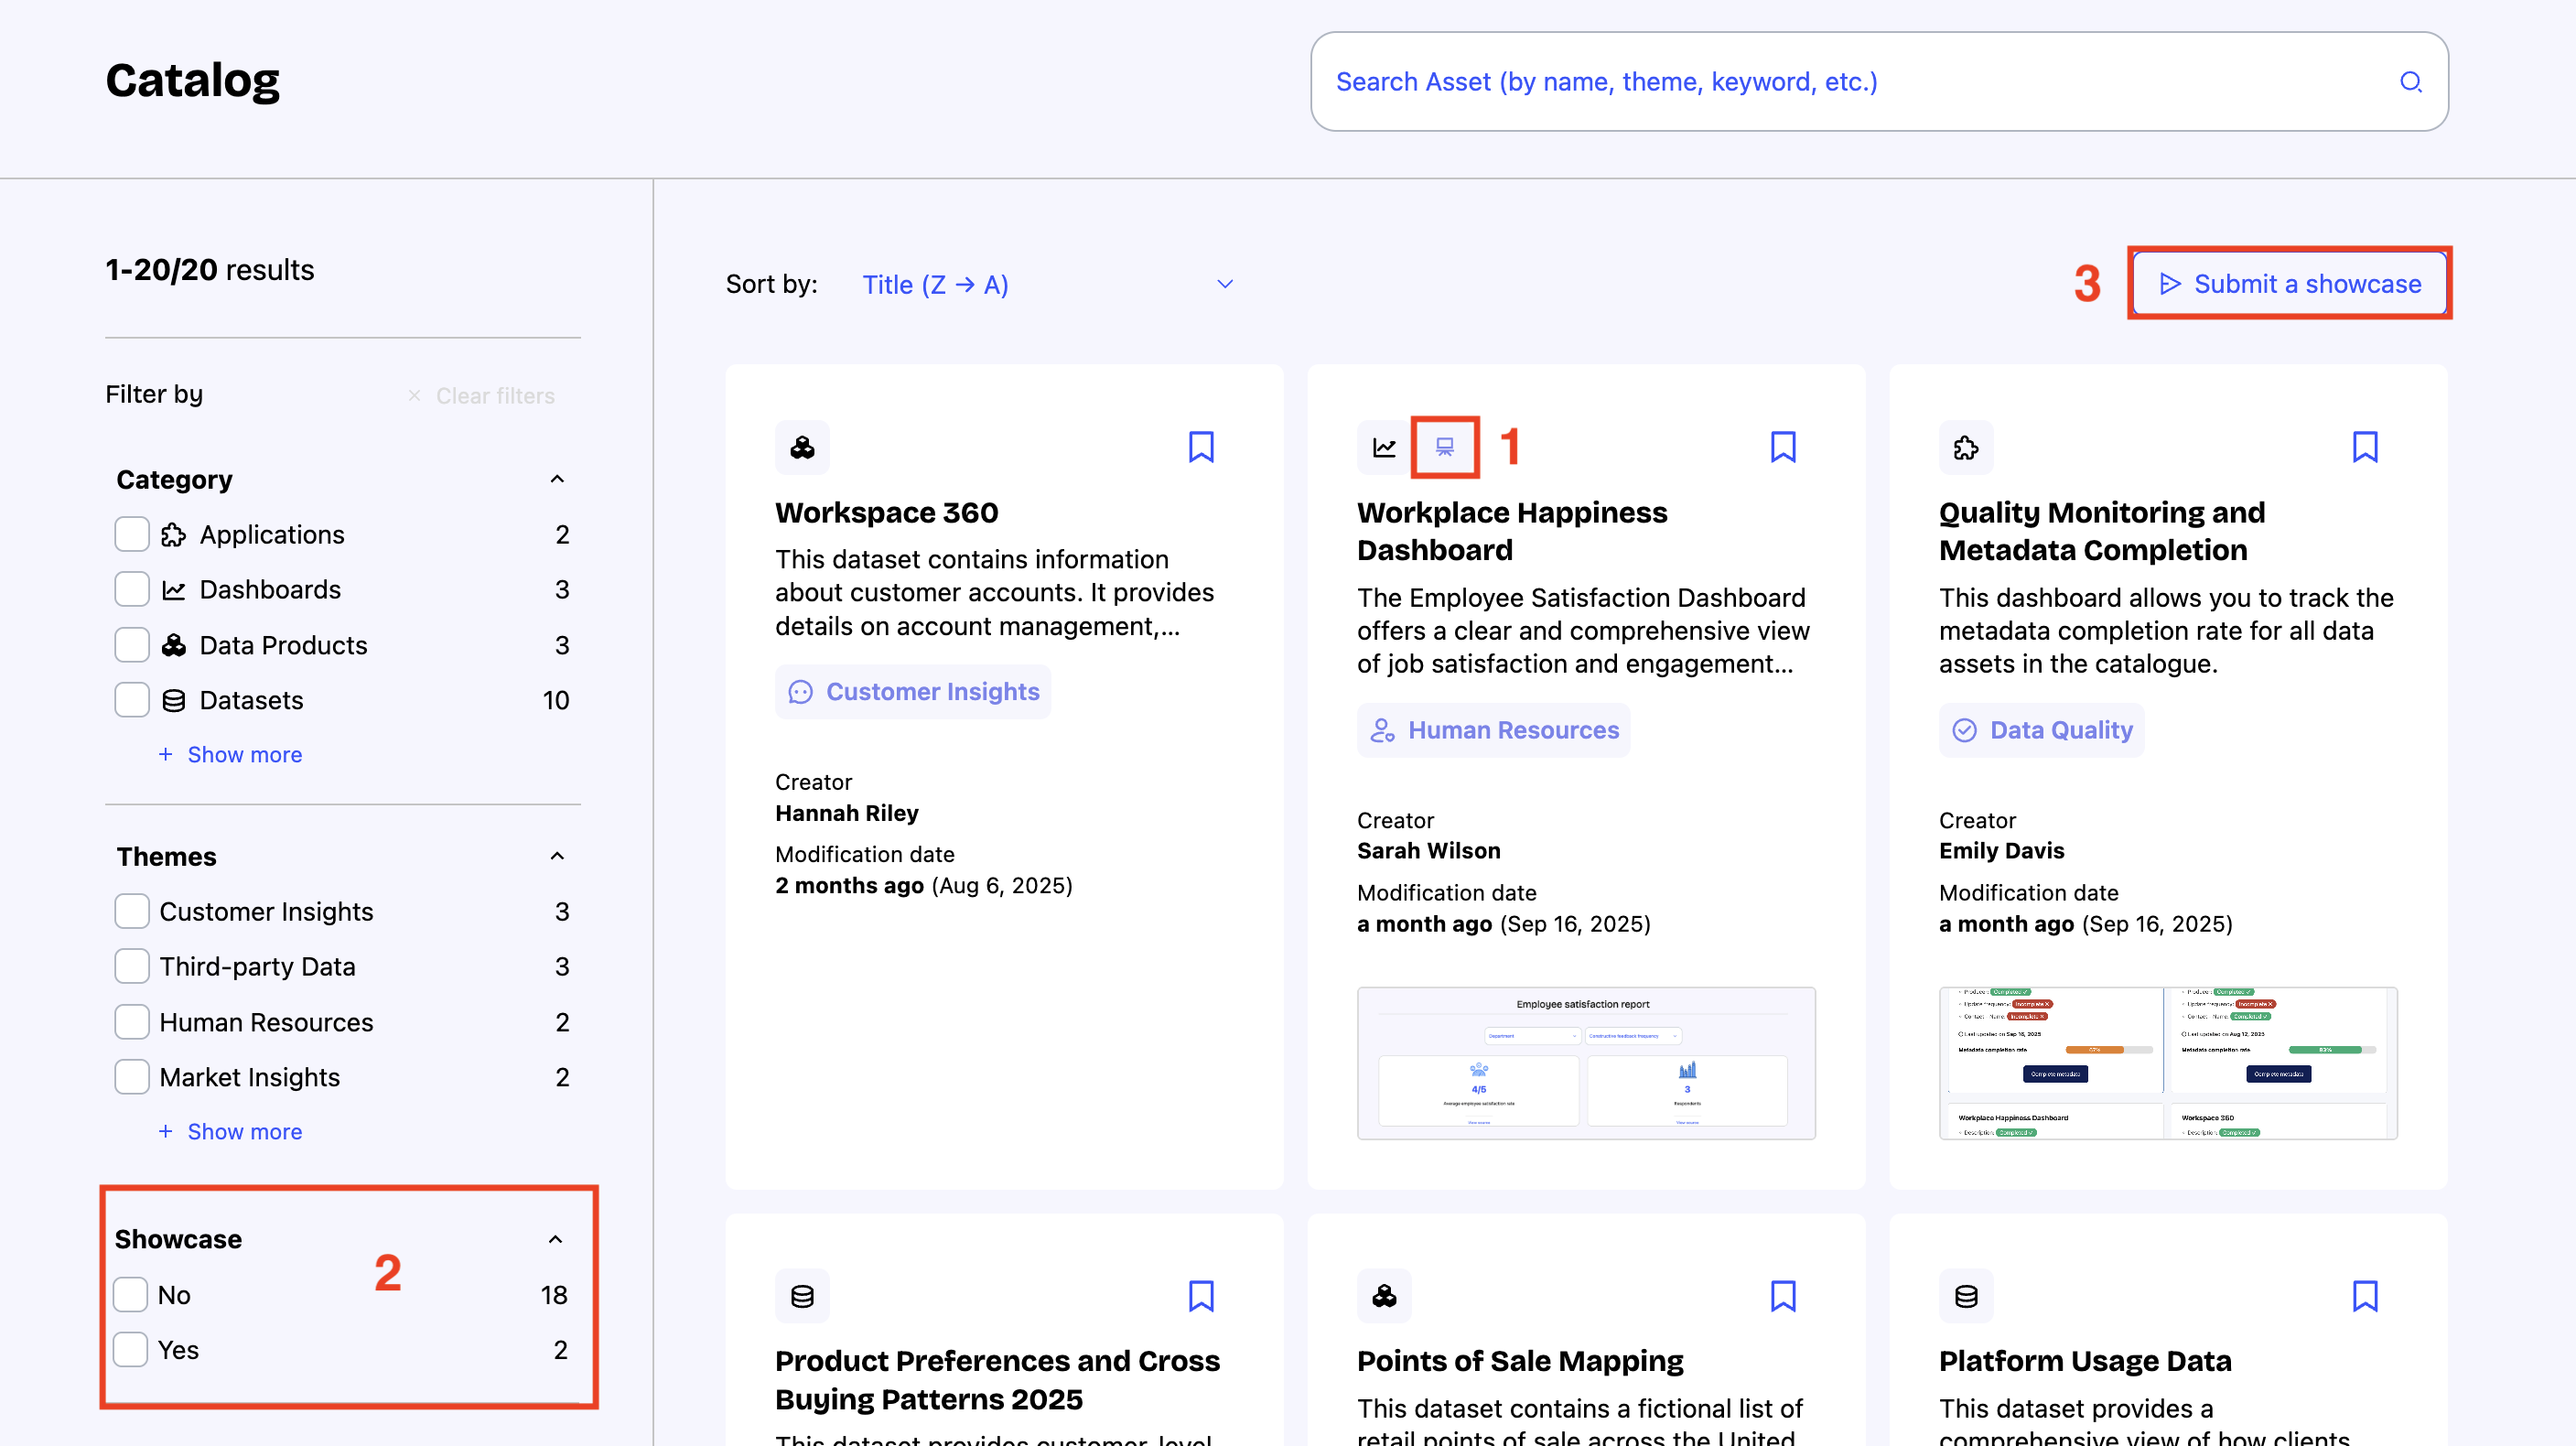
Showcases are easy to spot in the catalog — just look for the showcase label (1). You can filter catalog search results to see only assets tagged as showcases (2). Some portals may even have a dedicated menu item that links to all of them.
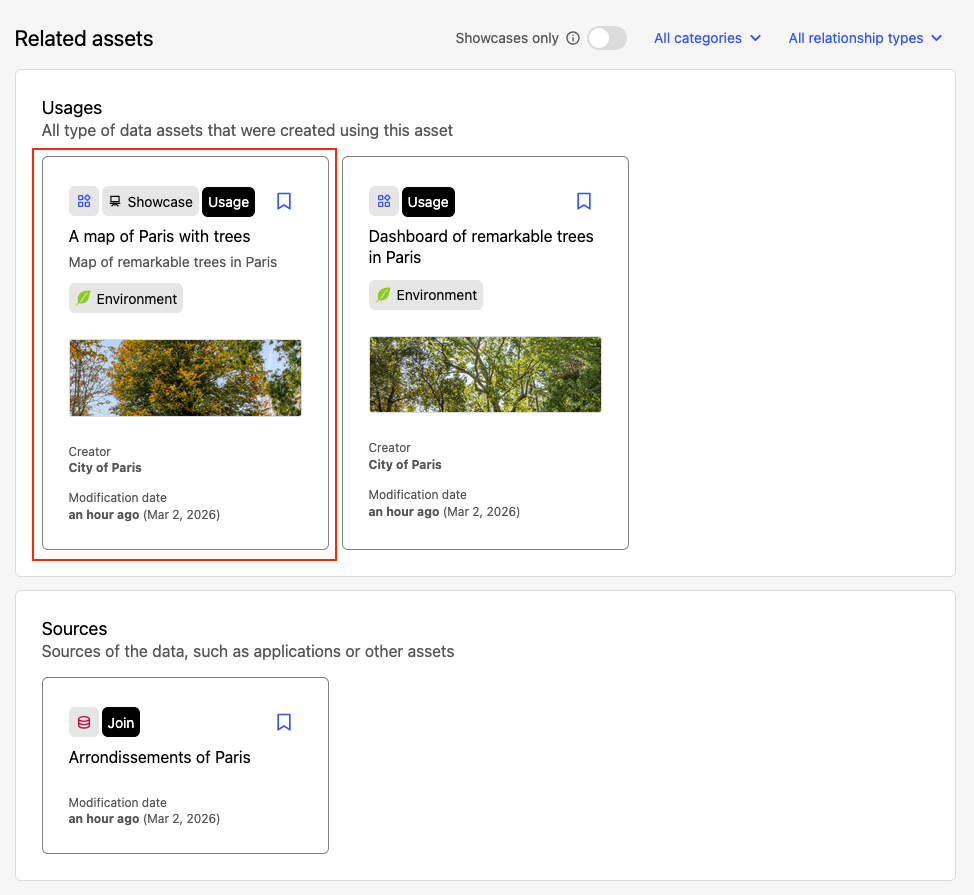
You can also find showcases listed directly on a dataset's asset page. They now appear in the Related assets section, under the Usages block — alongside other asset types that use that dataset, such as visualizations or federated assets.
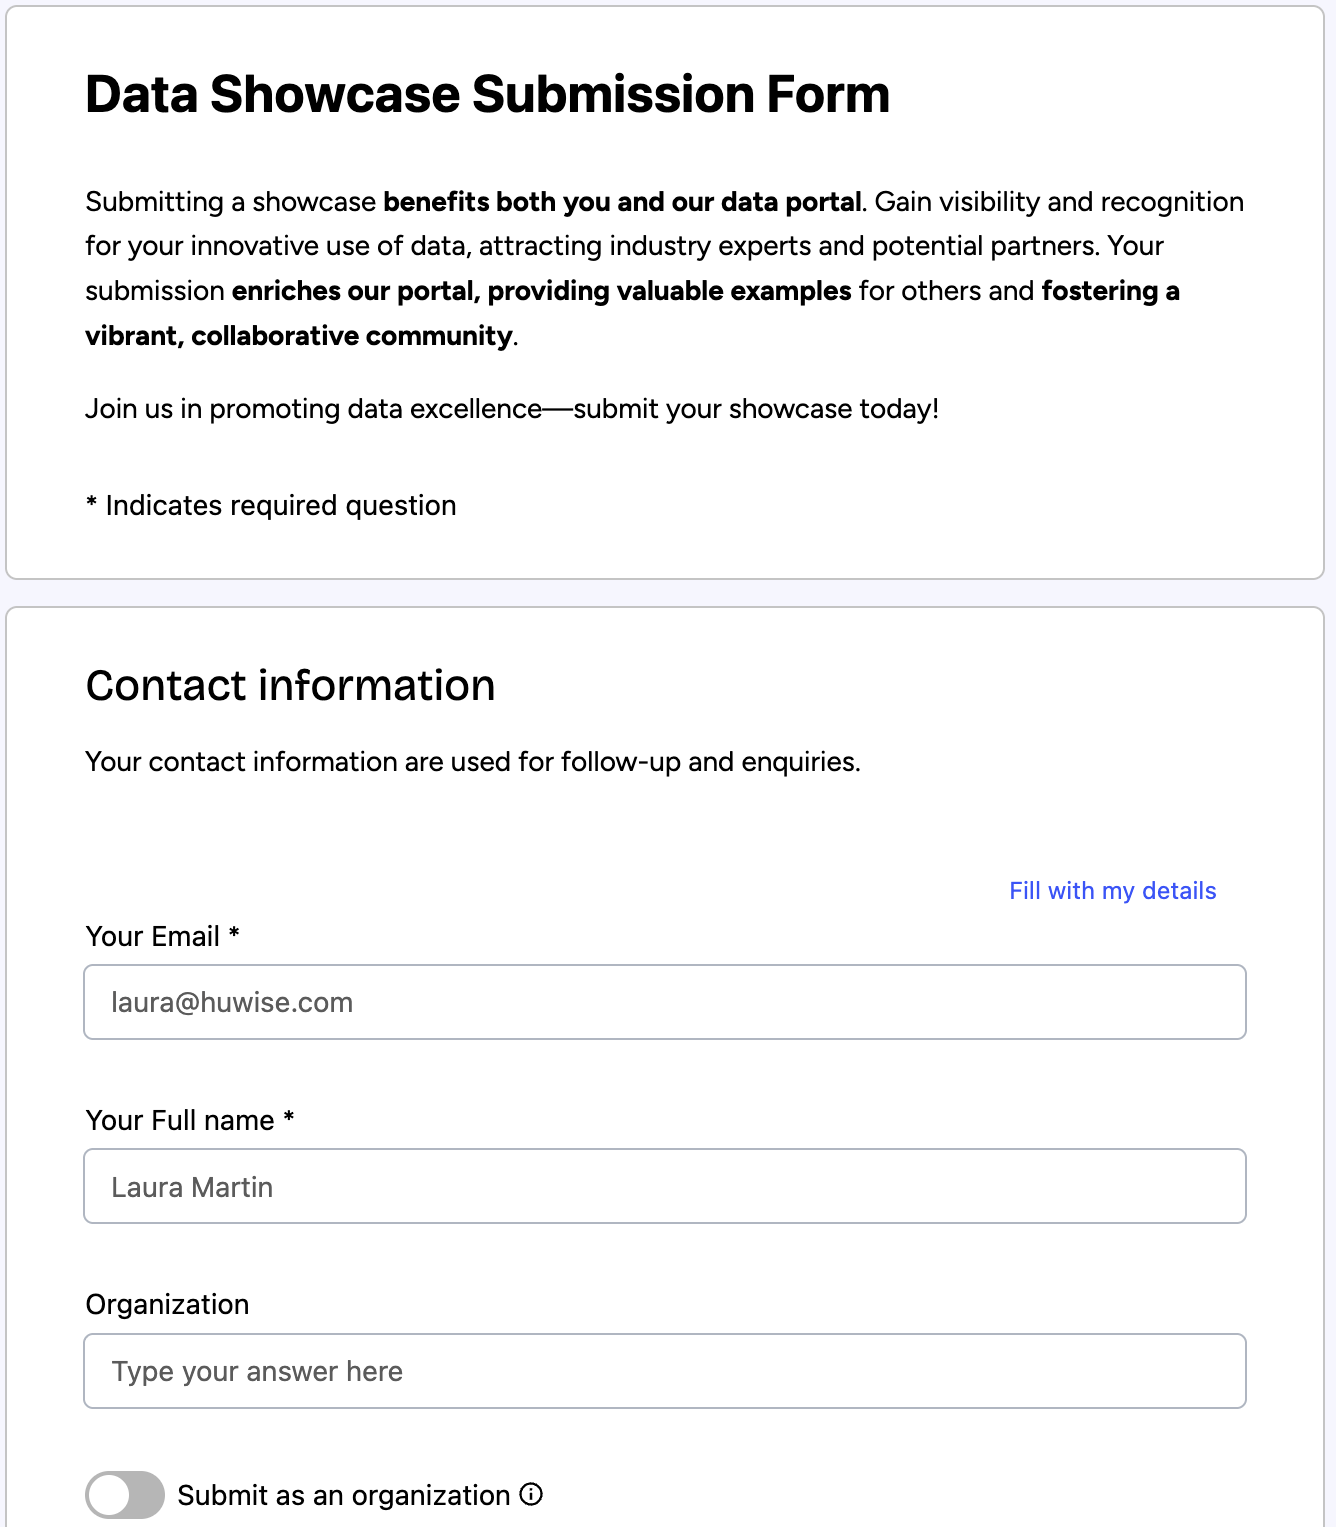
Your portal administrator may enable external submissions for new showcases (3). When submitting a request, you will be asked to fill in the basics: title, description, link to the data usage, goals, related datasets, etc. Note that you are given a choice to submit the showcase on behalf of yourself or your organization.
The submissions will land in the administrator’s request box, where they can review and approve them.