Using the Schema tab for insights
Imagine you've come across a worthwhile-looking dataset. How can you check if it has the information you need? Among the different features you can use is a dataset's Schema tab.
A dataset's Schema tab gives you a detailed view of a dataset's fields and their properties. This helps you assess if the dataset has the data you need and measure how complete and reliable it is before using it.
To see a dataset's Schema, go to the dataset, click on Explore data, then click on the Schema tab.
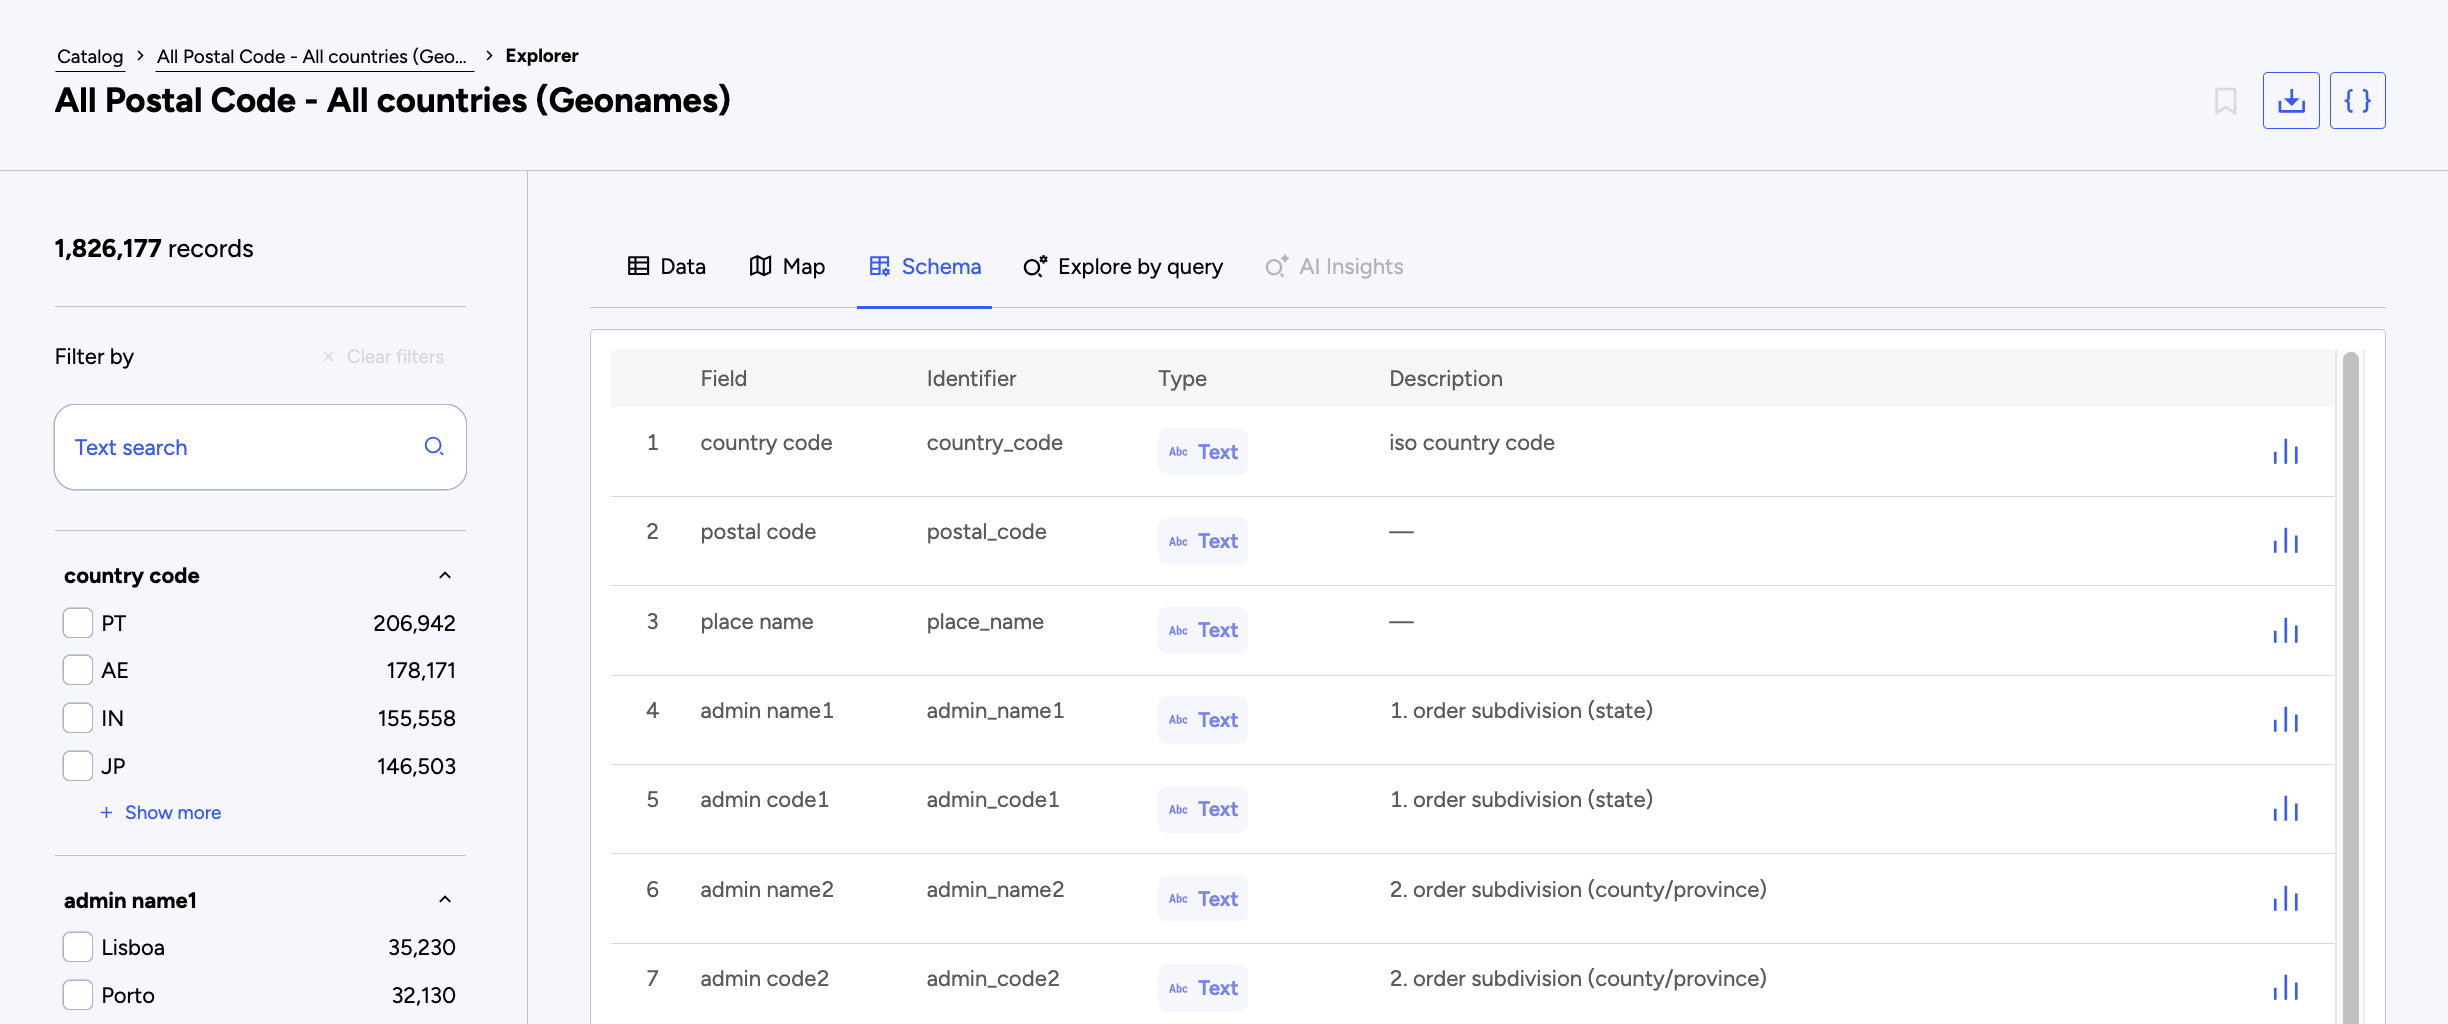
Tab view
Every dataset shows the same four pieces of information: The field's name, its identifier and type, plus a description if it was filled out.
To see more detailed information for each field, click on the small bar chart icon on the far right.
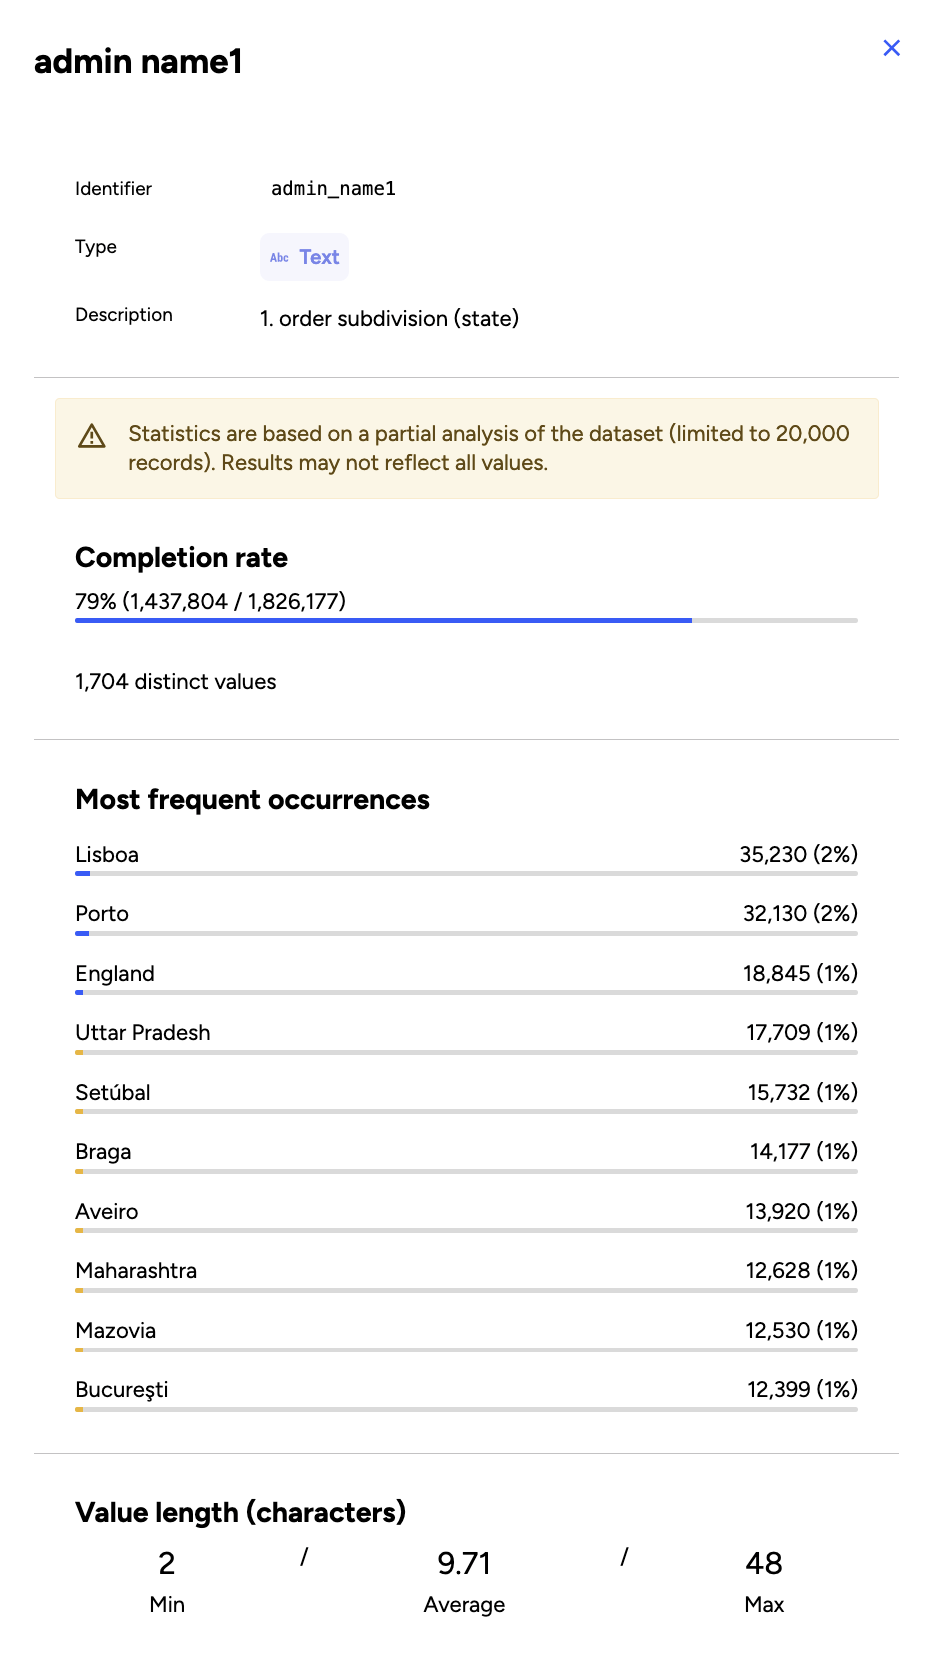
Detail view
Once you've clicked on the bar chart icon for a given field, you can see a more detailed view of the schema for that field.
The detail view displays the field's name, its identifier and type, plus a description if it was filled out.
Additionally, you are given the completion rate for that field, and number of distinct values, as well as further information and statistics, depending on the field type you're examining.
Examples of type-specific information provided
For example, the "Text" field type will show you the most frequent occurrences, with their number and percentage share of all occurrences. You're also given the length of the shortest and longest entries, as well as their average length.
The "Datetime" type will show you the oldest and most recent datetimes.
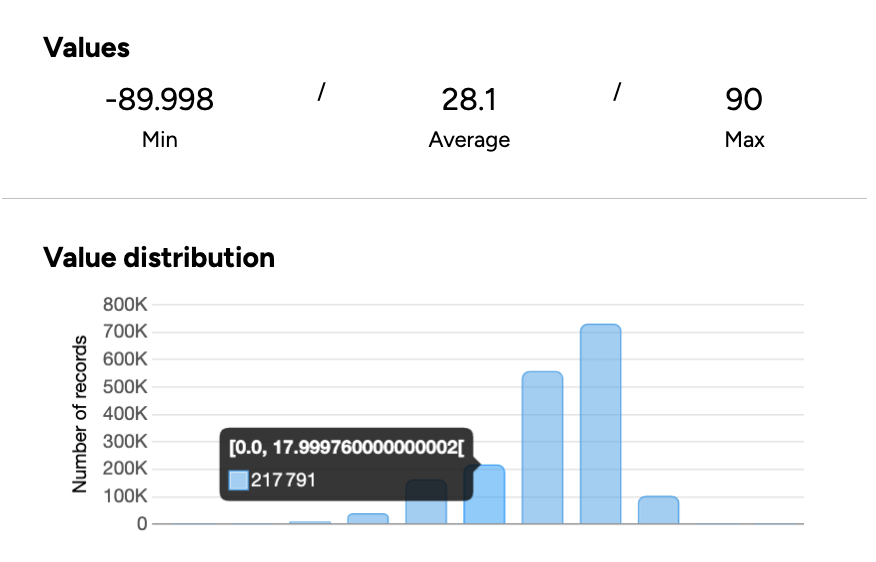
The "Decimal" and "Integer" types will give you the minimum, maximum, and average values. You will also see a bar chart of the distribution of the values in the dataset.