
Understanding your dataset's Analytics tab
You need the "Browse analytics" permission to see the Analytics tab. Remember that this permission means data contributors, for example, can be given this ability; you do not need to be an admin to use this tool.
In the back office, every data asset you publish has an Analytics tab, designed to allow you to know how people find and use your asset.
The Analytics tab gives you two different ways to look at your users' activity: one focused on how visitors move from discovering your asset to using it, and—if your asset is a dataset—another focused on raw usage volume.
Finding the Analytics tab
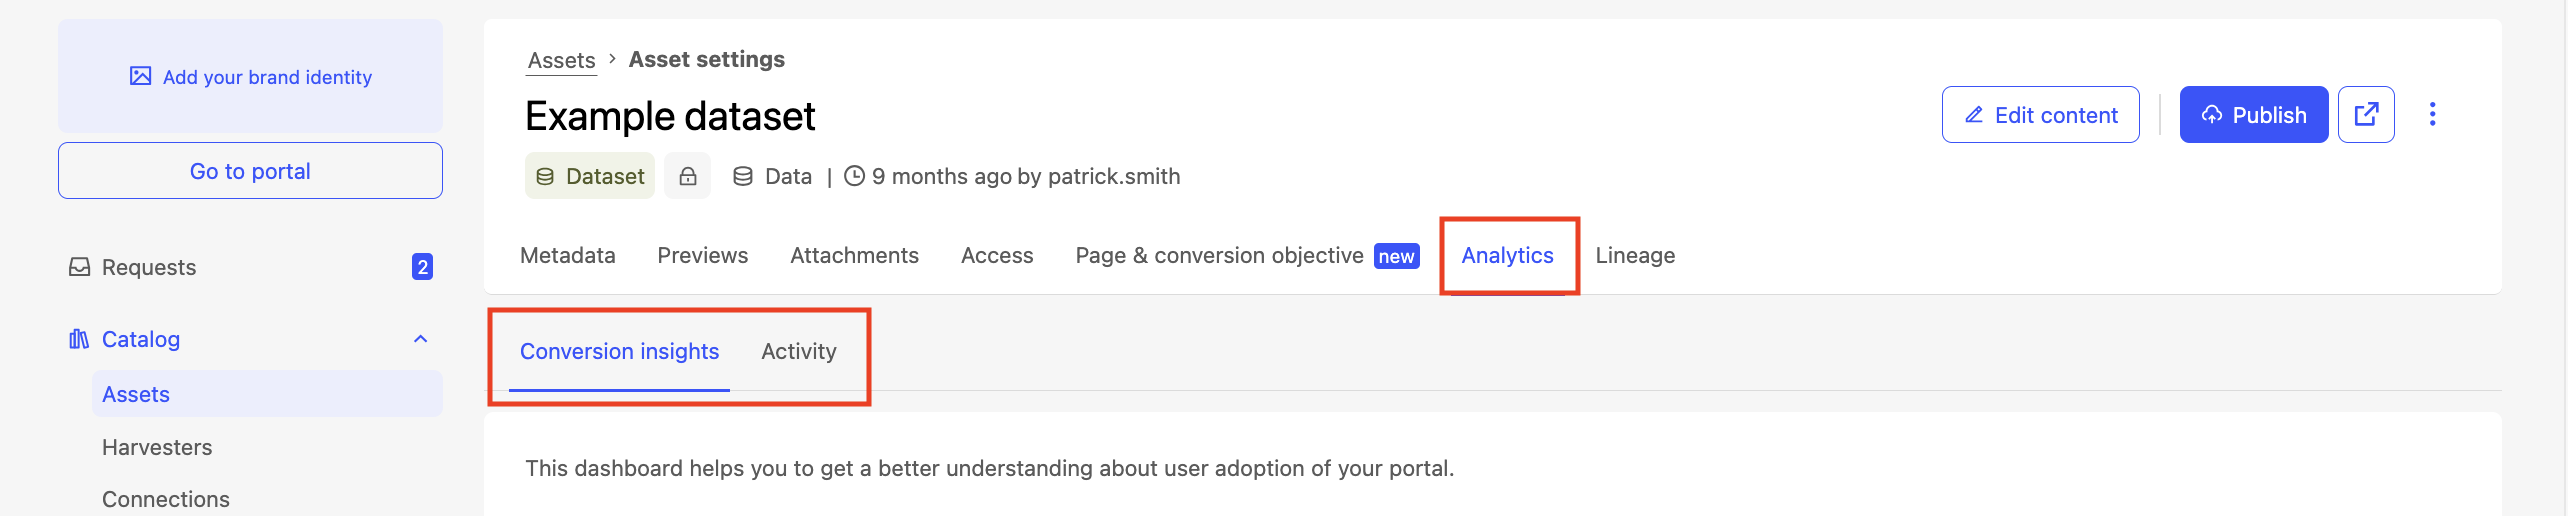
On your Assets page, select the asset you wish to analyze.
There, select its Analytics tab from the tabs at the top of the asset page. There you'll see the Conversion insights tab, selected by default, and the Activity tab if the asset is a dataset.
Two ways to analyze your asset
The Conversion insights and Activity tabs allow you to answer two different sets of questions:
Conversion insights tab
The Conversion insights tab helps you understand how visitors discover your asset, and if and how they use it.
It shows you how many people saw your asset in search results, how many clicked through, and how many of those visitors went on to use its main consumption tool, such as downloading the data or opening a visualization.
If you want to know whether your asset page is doing its job at turning visitors into users, this is the view you need.
See Analyzing your asset's conversion funnel for more information.
Activity tab
The Activity tab shows you raw usage volume instead: how many users interacted with your dataset, how many times it was downloaded, and how many API calls were made against it, including where that activity came from.
If you're trying to answer "how much is this dataset being used overall," this is the view for you.
See Analyzing a dataset with its monitoring dashboard for more information.