
Analyzing your asset's conversion funnel
On your asset's Analytics, the Conversion insights tab helps you understand how visitors move from discovering your asset to actually using it.
You need the "Browse analytics" permission to see this tab. Note that this permission can be granted to data contributors on its own, so you don't need to be an admin to use it.
See Analyzing a dataset with its monitoring dashboard if you're looking for raw usage numbers on a dataset instead — downloads, API calls, and where your traffic comes from. These are found on a dataset's Activity tab.
Choosing a date range
A date-range picker sits at the top of Conversion insights and controls every card below it. Choose the period you want to analyze, and the click-through rate, funnel conversion rate, funnel diagram, and trends chart all update to match.
Understanding your click-through rate (CTR)
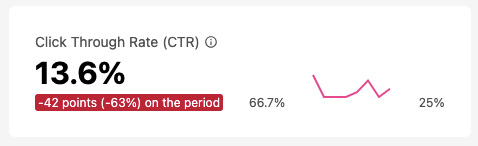
Your click-through rate (CTR) tells you how many people who saw your asset in search results actually clicked through to its overview page. More precisely, your click-through rate (CTR) is the percentage of your asset's search-result impressions (the number of times the card was shown) that led to a click through to its overview page.
A low CTR can mean your asset isn't standing out in search results, even if it receives plenty of impressions. If your CTR is low, check whether its title and other metadata make its content and purpose clear.
The CTR shows a sparkline, or a small daily trend line, so you can spot whether it's improving or declining over the selected period without switching to the full trends chart.
Understanding your funnel conversion rate (FCR)
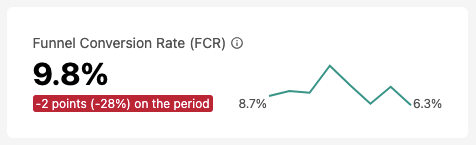
Your funnel conversion rate (FCR) tells you how many visitors who reached your asset's overview page went on to actually use it, by clicking its main consumption tool — a download button or a link to a visualization, for example. More precisely, your funnel conversion rate (FCR) is the percentage of views of your asset's overview page that led to a click on its main consumption tool.
Remember that this metric only means something once your asset has a conversion objective configured — the main action you expect visitors to take, such as exploring the data or downloading it.
See Configure your asset page to set or change it.
If the objective is appropriate but your FCR remains low, check whether the asset page clearly explains what the asset contains and what users can do with it.
Visualizing your results
Your conversion funnel
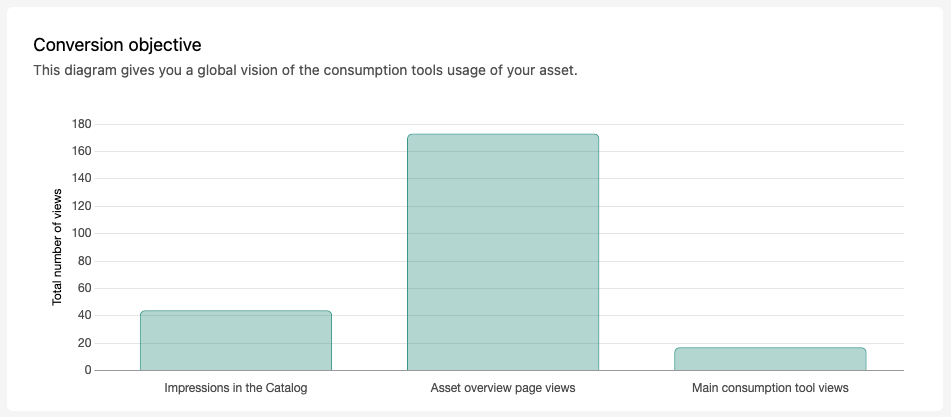
The "Conversion objective" chart gives you a global view of your funnel — how your traffic narrows at each stage, from impressions to landing on your asset's overview page to actually using its main consumption tool. It's the fastest way to see how well you're maintaining your visitors throughout the funnel.
Tracking trends over time
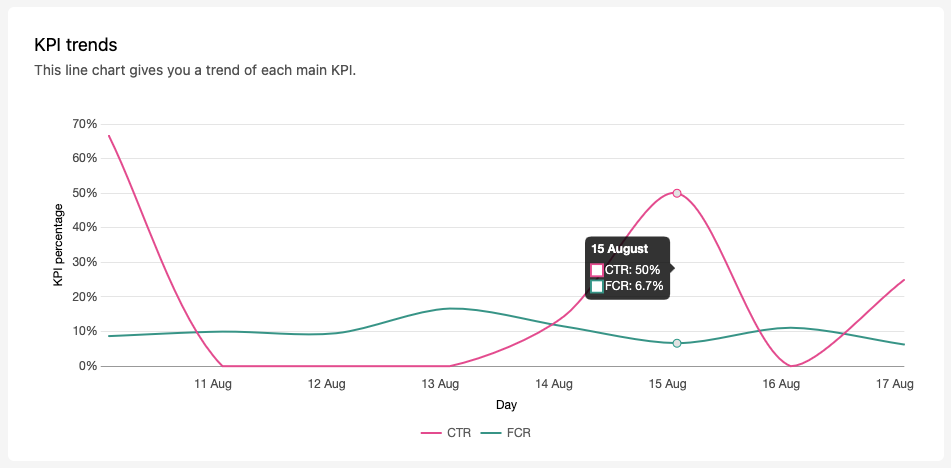
The KPI trends chart plots your CTR and FCR together as two lines over the selected date range, distinguished by color, so you can see at a glance whether your asset's discoverability and conversion are improving, declining, or holding steady — rather than only seeing where they stand today.
If your funnel conversion rate looks lower than you'd expect, start by checking whether your asset's conversion objective still reflects the action you actually want visitors to take.