Creating custom views
Custom views are used to offer visual insights, using charts, graphs, maps, or key figures, into what a dataset contains and might allow as user to do.
Once a custom view is added to a dataset, a button will be added among the dataset's calls to action in the portal, as well as in the list of CTAs down the right side of the dataset. Like in the image below, it can even be the main CTA, depending on the conversion objective you define for the dataset.

Creating and configuring a custom view
To create a custom view for a dataset, click Edit content in the dataset, then click on the Custom Views tab.
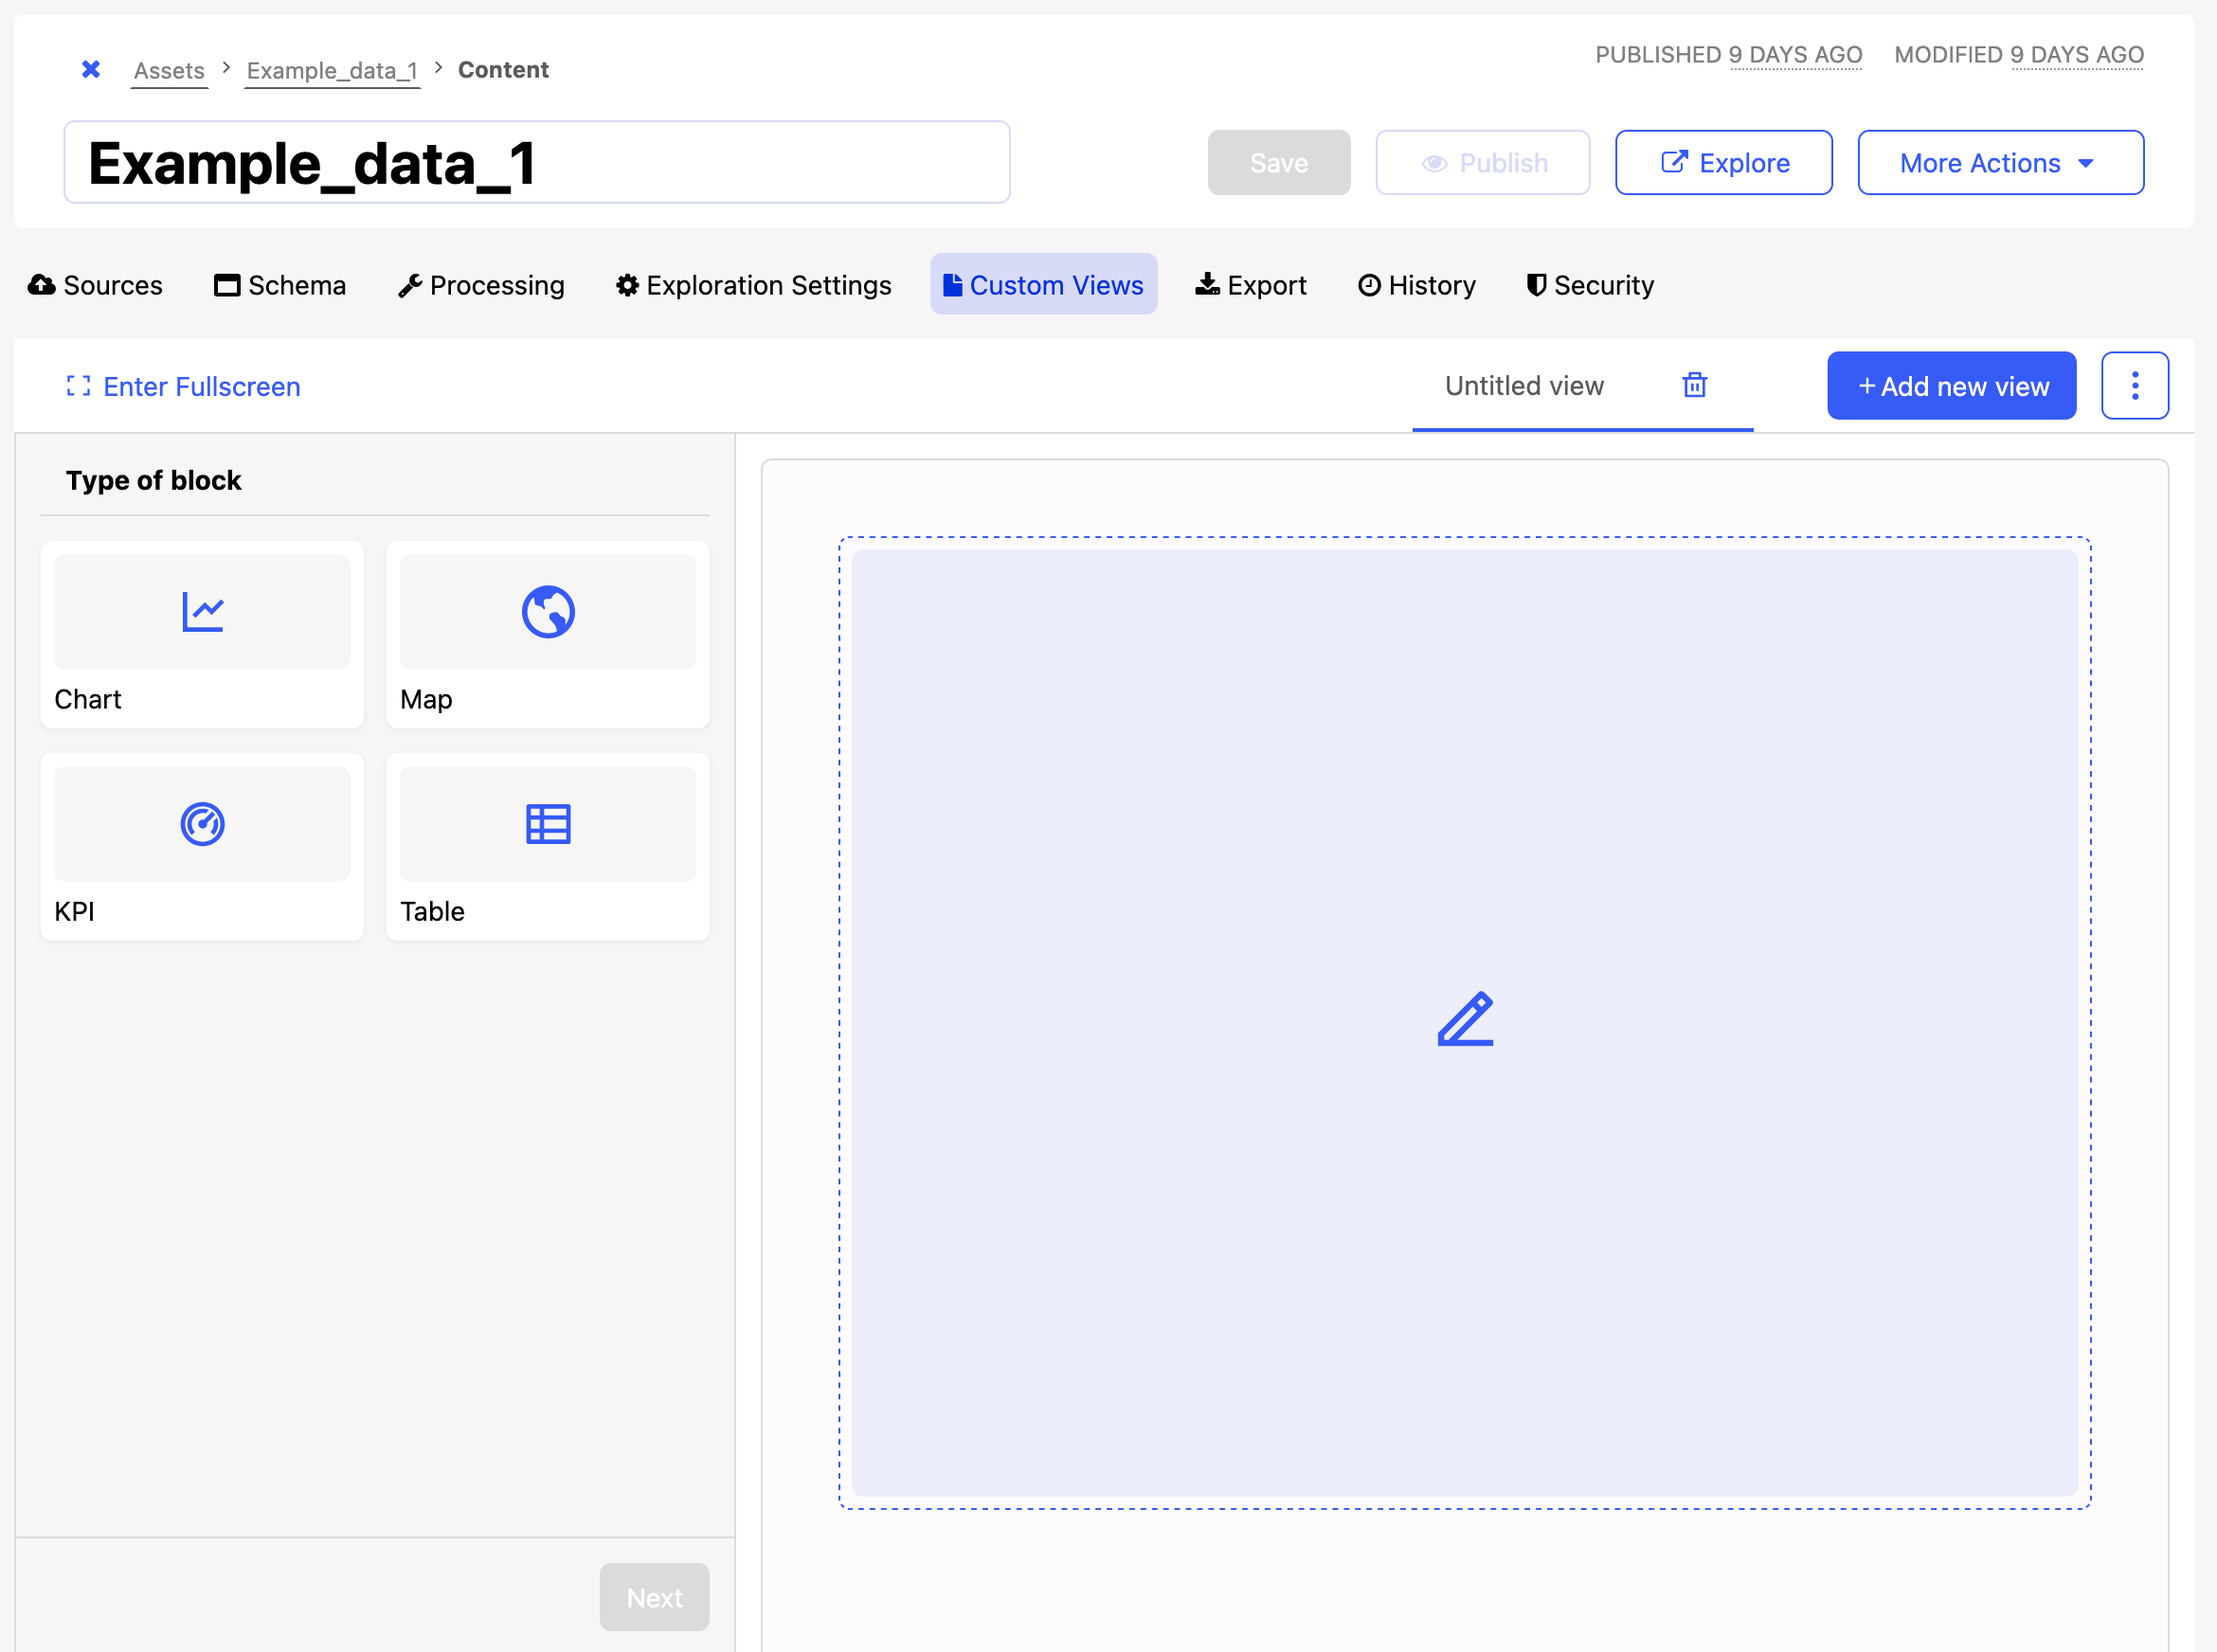
A custom view can include charts, maps, tables, or key figures ("KPI").
These are configured identically to any individual block on a Studio page. See the following documentation pages for Studio: charts, maps, KPIs, and tables.
You can create a maximum of seven custom views.
Viewing custom views in the portal
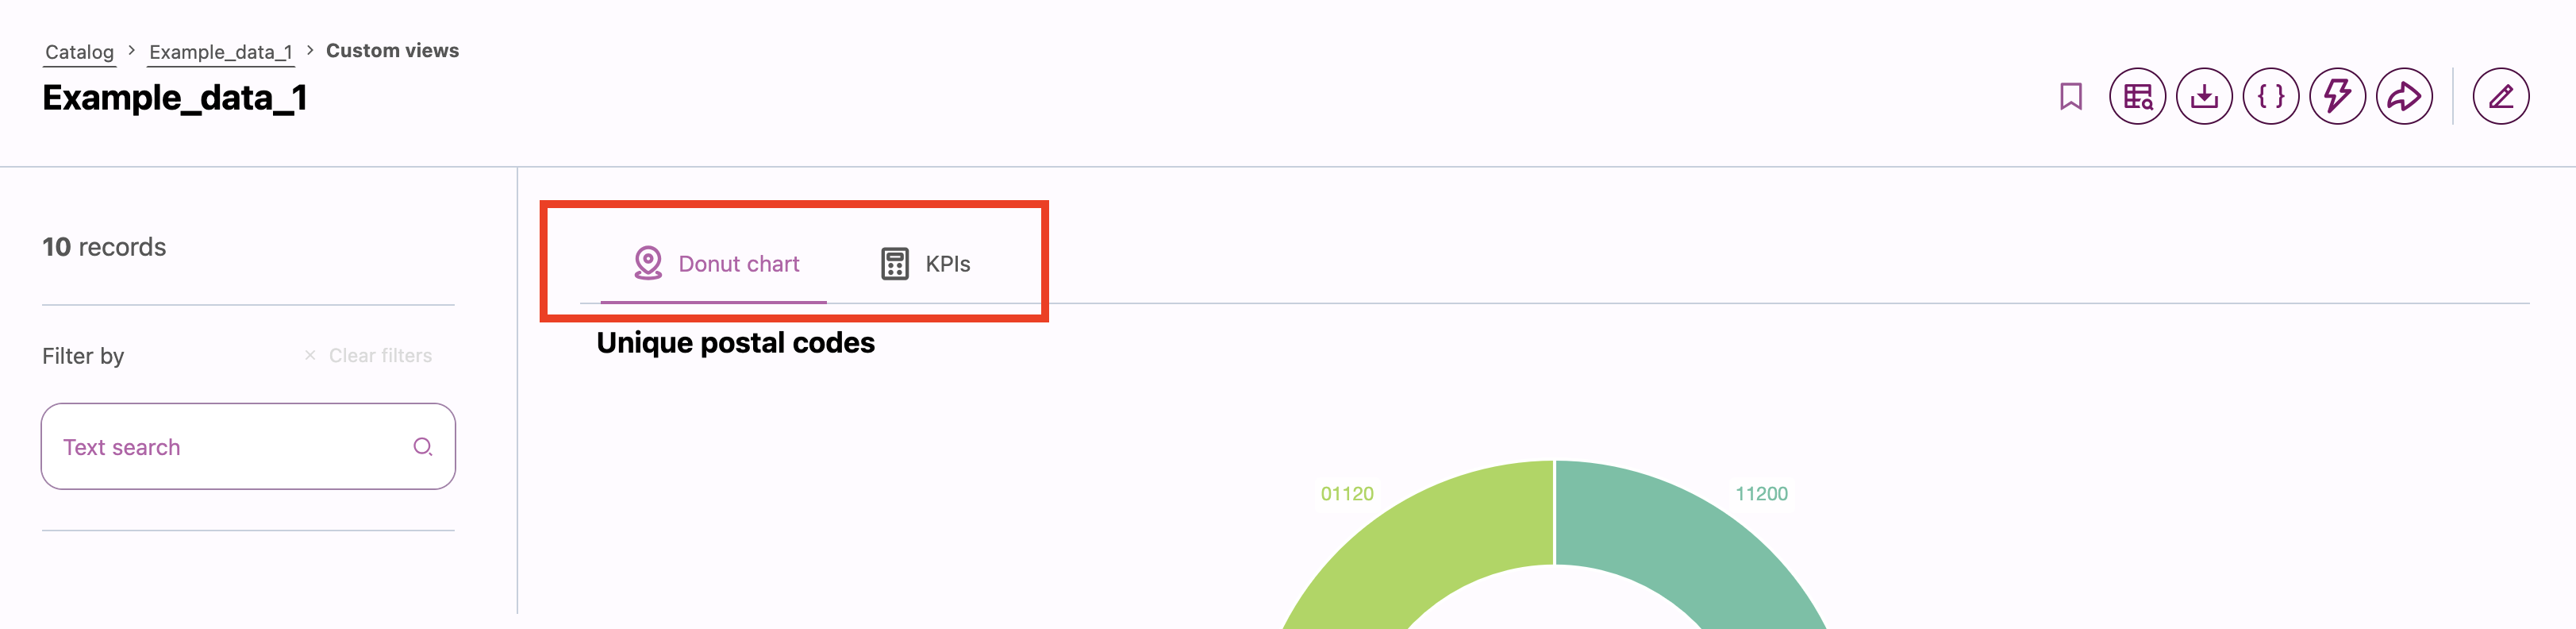
Once configured, a dataset's custom views are visible in the portal when the custom views CTA is clicked.
If multiple custom views are created for a dataset, they will be selectable as tabs.