
Exploring data through custom views
A dataset may include custom views: preconfigured visualizations created by the data publisher to make the data easier to understand, or else to highlight specific insights.
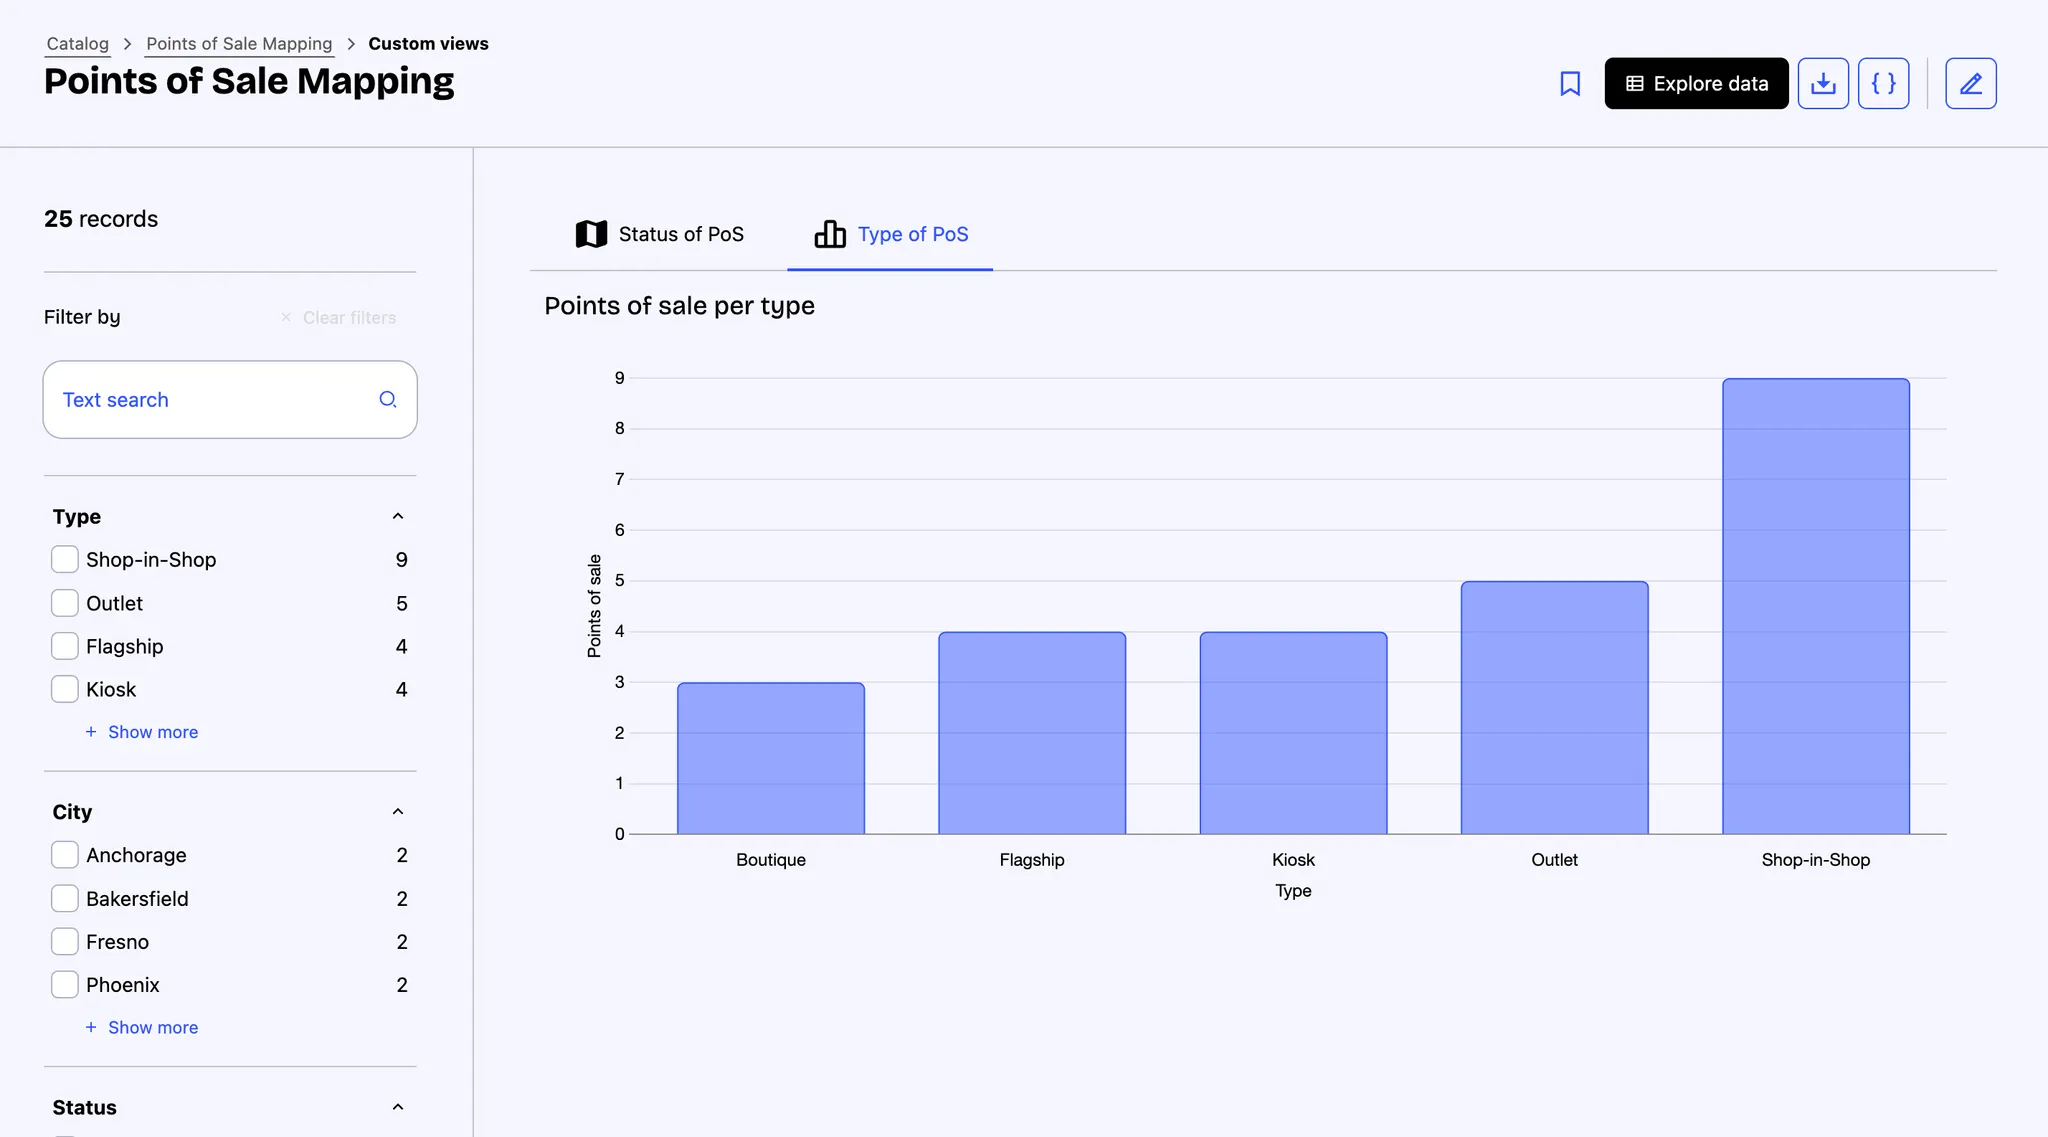
When available, custom views can be accessed via the Show views button, either from the asset page or within the Explore data view.
Custom views can take various forms, such as maps or charts, and appear as tabs. Among the available map types, the Points & shapes map lets you display points, lines, and polygons simultaneously, each with individual styling options. For more information, see Adding a map with points and shapes in Studio.
You can switch between the data explorer and custom views using the buttons in the top-right corner. Applied filters stay consistent through all consumption tools.