
Exploring a dataset
Datasets are an important asset type on most Huwise portals. And at the heart of a dataset is naturally the data itself—but a dataset is far more than just raw data.
From the asset page, the Explore data button opens the dataset in Explorer, where you can view and interact with the data.
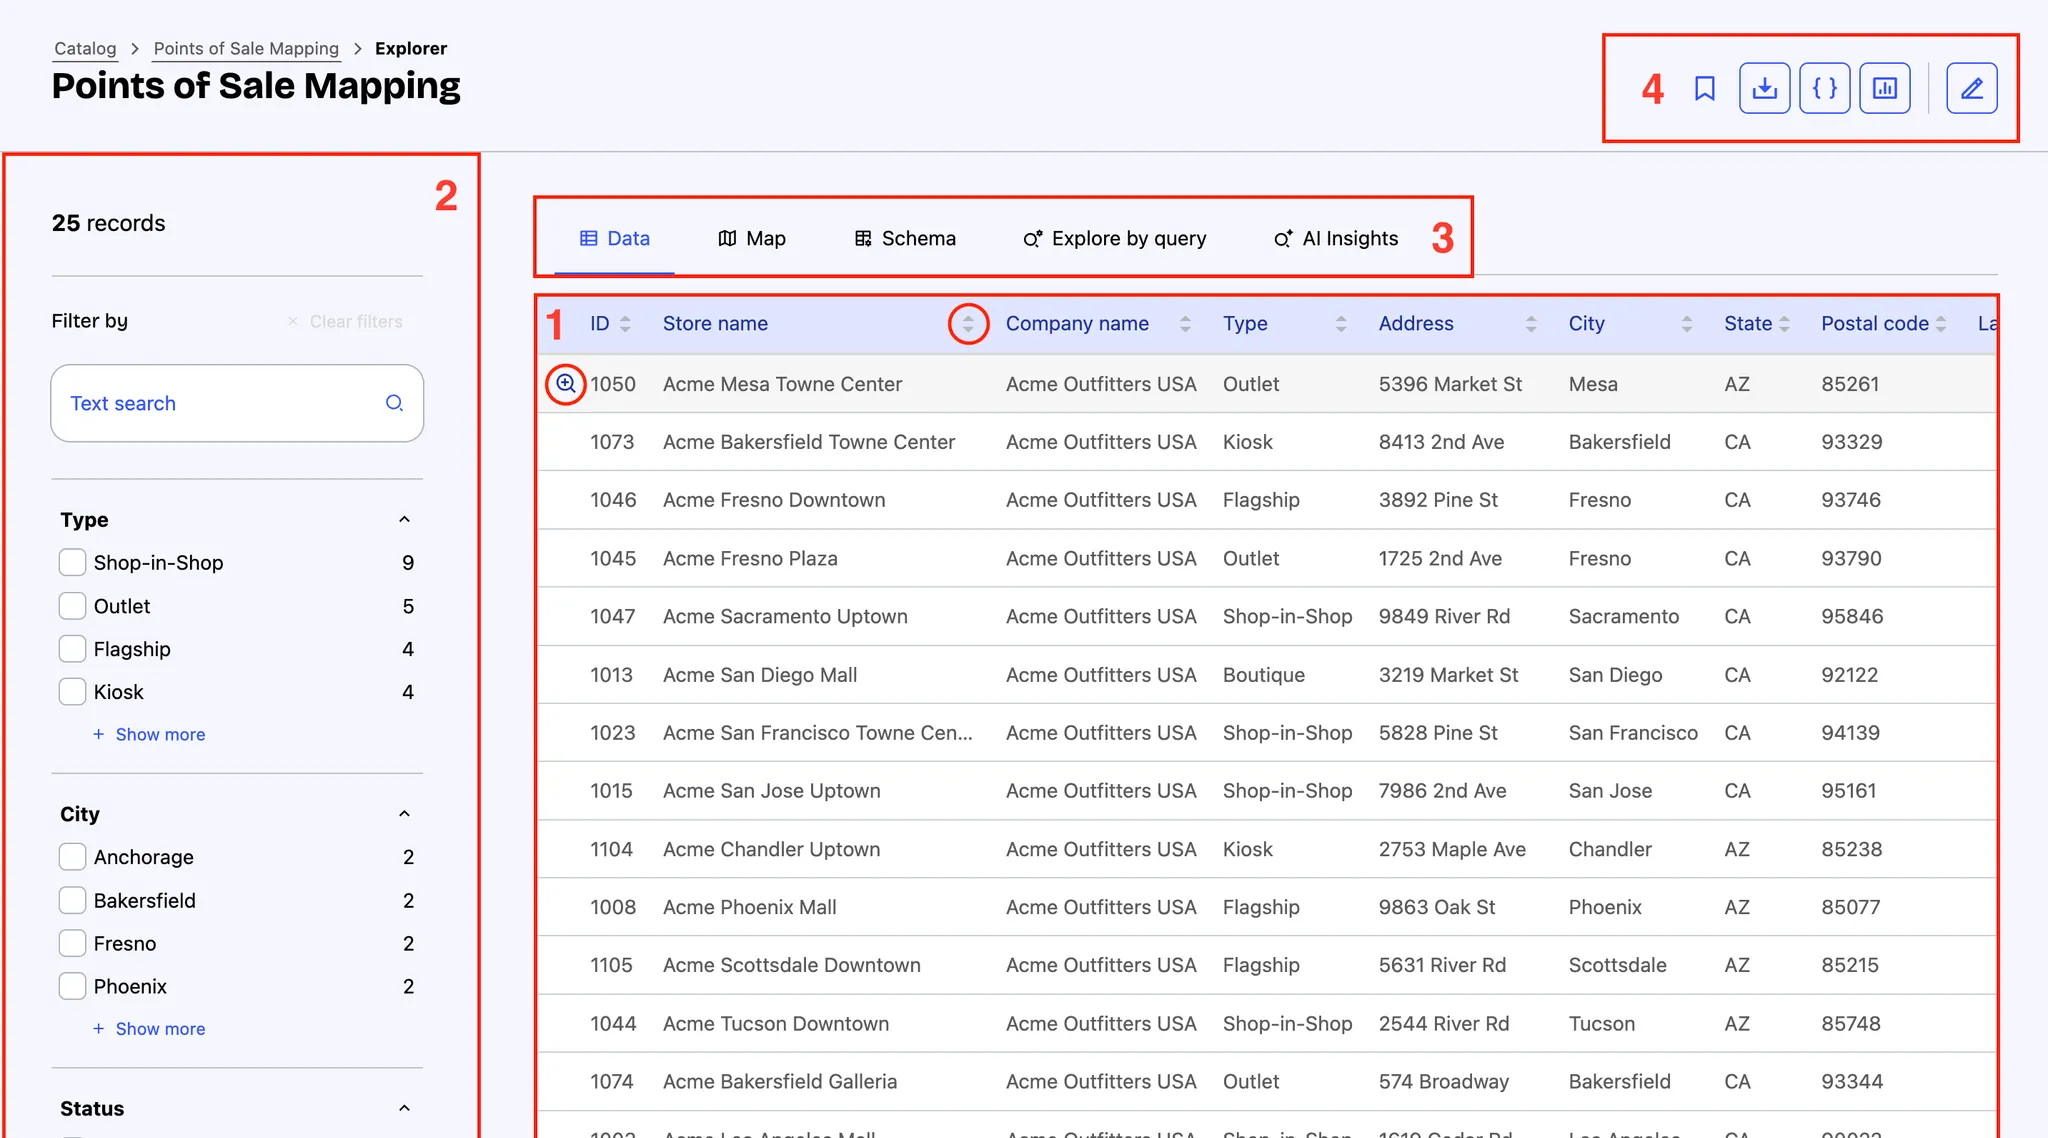
1. Data tab
You first land on the Data tab, which displays the dataset in a table view as configured by the asset owner.
Each field is represented as a column, which can be sorted by clicking its header. Click once to sort in ascending order, click again for descending order, and a third time to clear sorting.
Each record appears as a row. Click on a row to open a side panel with all field values for easier reading.
2. Filters
On the left panel, you can refine your view using the available filters.
The search bar lets you find entries by keyword.
Below, filters (when configured) help narrow the results. The type and order of these filters is defined by the asset owner and may vary across assets. If more than five filters are available, a Show more button appears to reveal the rest.
3. Other tabs
In addition to the Data tab, the Explore dataset page offers several other views to help you gain deeper insight into the data:
The Map tab: If any of the data can be mapped, up to than 2000 datapoints can be seen here in map form.
The Schema tab: Allows you to see the dataset's schema, or in other words all of the column headers in the dataset, but with their identifier, their data type, potentially a description, as well as other information available when the user clicks on the icon on the far right, according to the field's data type.
The Explore by query tab: This feature allows you to quickly build useful API calls without having to do so manually. For more information about using the API, see here.
The AI insights tab: A feature designed to allow you to ask simple, natural-language questions of the dataset. See here for more information.
4. Other ways to consume a dataset
In the top-right corner, several buttons provide other ways to consume the data:
Bookmark saves the asset to your personal bookmarks, accessible from Account > Bookmarks.
Export data allows to download the dataset in multiple formats, such as CSV.
Use API console to generate an API request and connect data to external apps.
Show views takes you to visualisations preconfigured by the data publisher for easier interpretation.
Edit button is available only to users with editing permissions. Opens the asset in the back office: the asset manager or the asset builder, depending on where it’s accessed from.
Configuring a dataset
For data publishers: you can adjust how users experience the dataset and guide them to explore and make use of the data.
Consult the following pages for instructions on how to go about:
Configuring the asset card (coming soon)
Configuring the layout and order of the information on the asset page, as well as which call to action you want to feature most prominently